PoolPal Platform
Designing a real-time operational platform for commercial pool automation
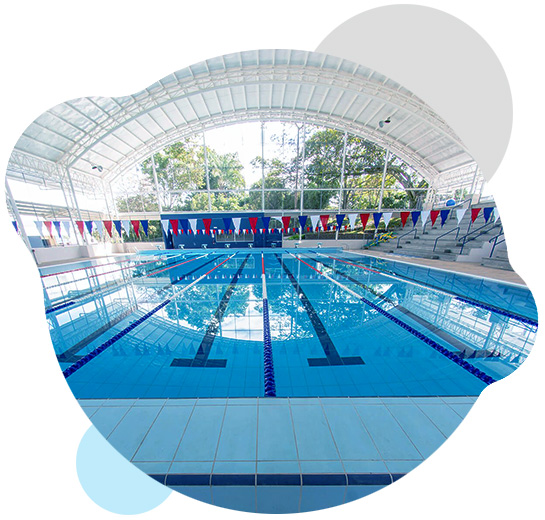
A responsive SaaS web application combining admin tools, real-time dashboards, connected device interfaces, and monitoring workflows for commercial swimming pool operations.
YEAR
2022
DURATION
1 Year
ROLE
Sole UI/UX Designer
TOOLS
Figma, Adobe Illustrator
Overview
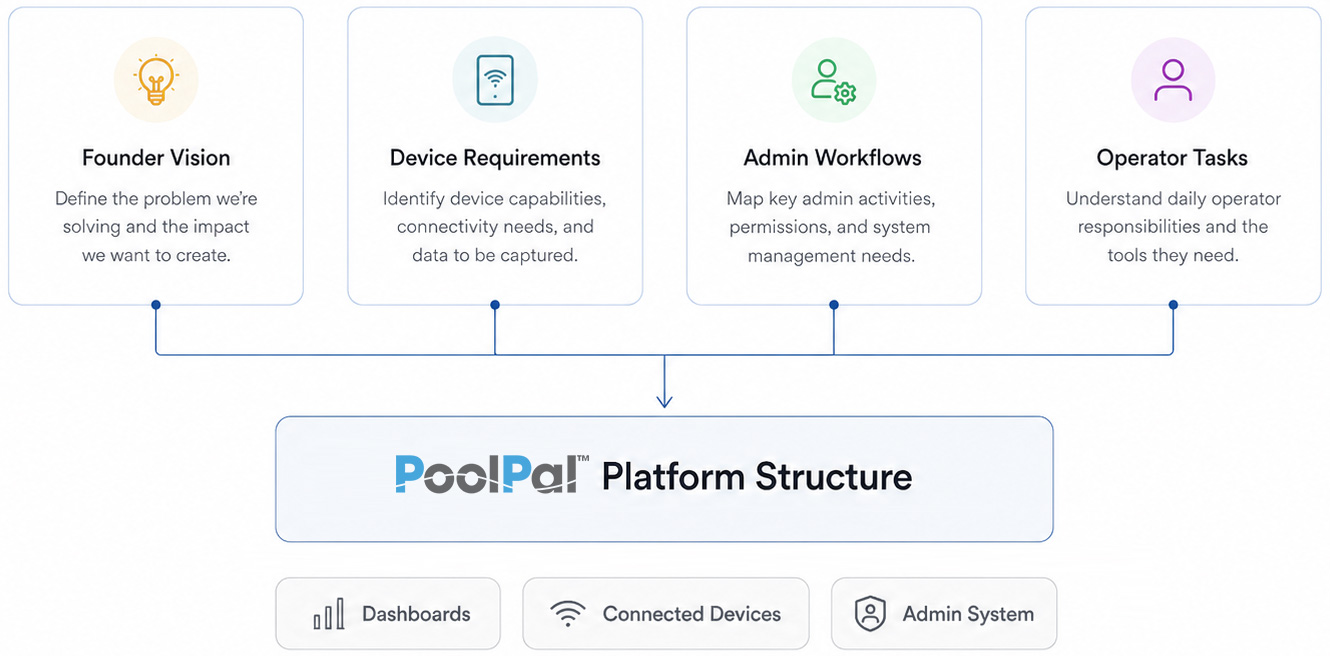
Discovery & Product Context
Before designing the platform, I worked closely with the founder and development team to understand the operational landscape, product requirements, and connected device ecosystem.I also needed to understand the technical direction of the platform early on, including the component framework the development team planned to use.
The Challenge
Commercial pool operations involve large amounts of operational data, connected hardware systems, maintenance workflows, and time-sensitive monitoring procedures.
The challenge was designing a platform capable of:
✓ Simplifying complex operational workflows ✓ Supporting rapid decision-making ✓ Managing multiple connected devices ✓ Visualizing live system data clearly ✓ Scaling across dashboards and admin interfaces ✓ Adapting complex dashboards for responsive web use ✓ Designing within Ant Design component constraints ✓ Creating both monitoring and settings experiences for multiple device types
The Solution
Design Priorities
✓ Modular dashboard structure ✓ Real-time data readability ✓ Scalable UI patterns ✓ Centralized admin management ✓ Simplified operational workflows ✓ Consistent device configuration ✓ Responsive web application behavior ✓ Development-friendly UI patterns
Designing the Platform Ecosystem
To support the platform’s growth, I organized the experience around connected products, real-time monitoring tools, and centralized admin workflows. This structure helped keep dashboards, devices, and operational controls consistent across the PoolPal ecosystem.
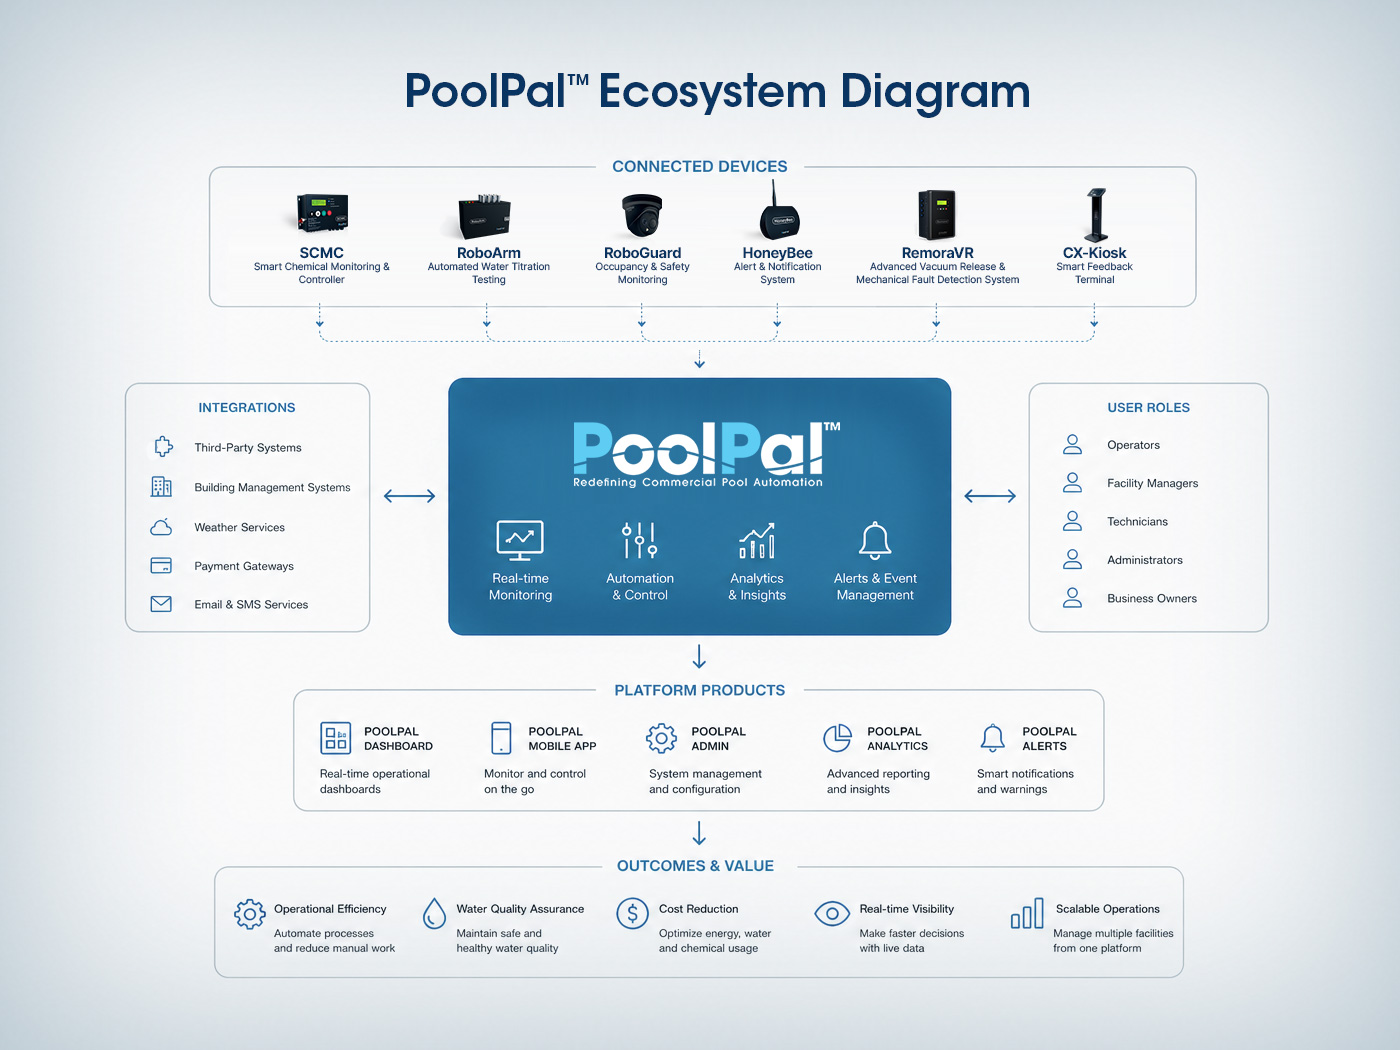
Platform Ecosystem Diagram
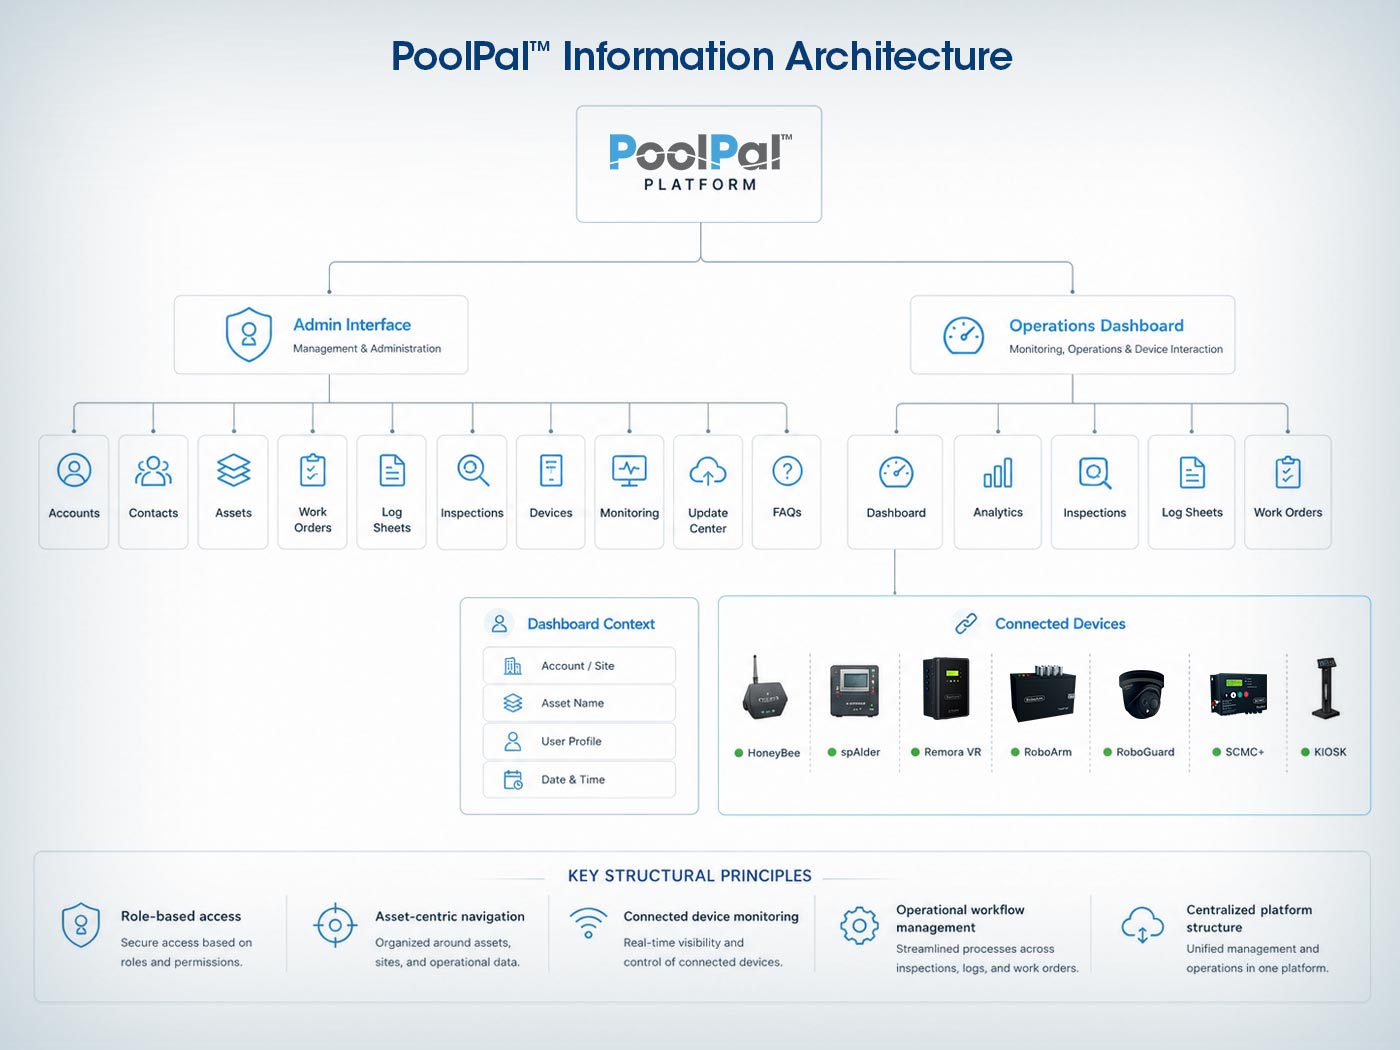
Information Architecture
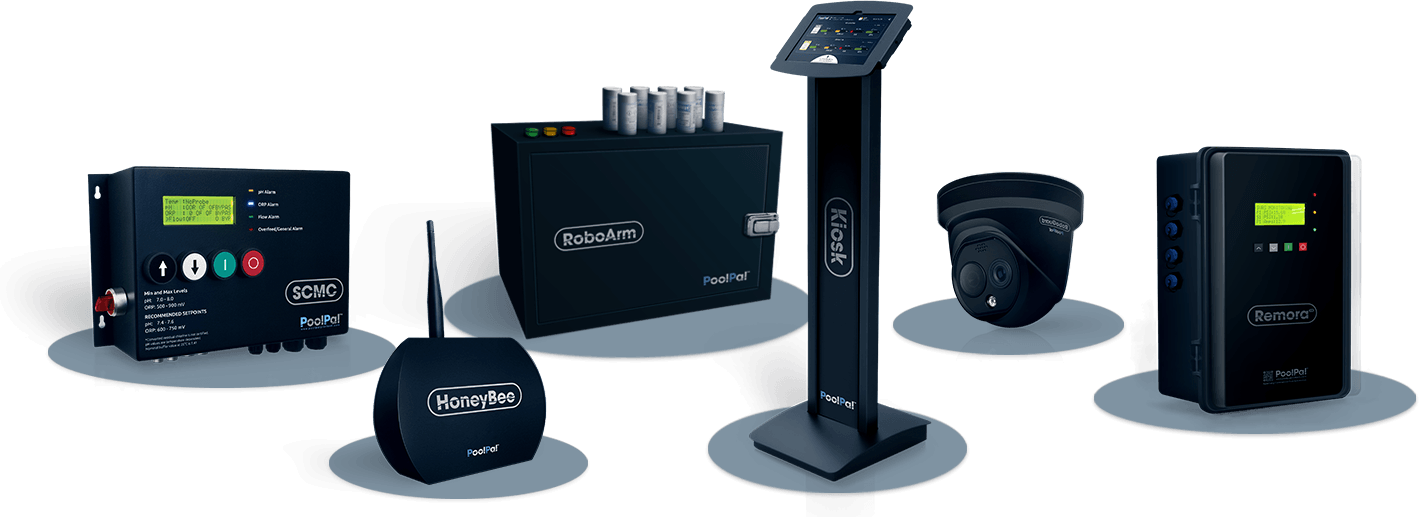
Connected Device Layer
I treated the hardware ecosystem as part of the user experience, because each device introduced its own data, status, alerts, and control needs inside the platform.
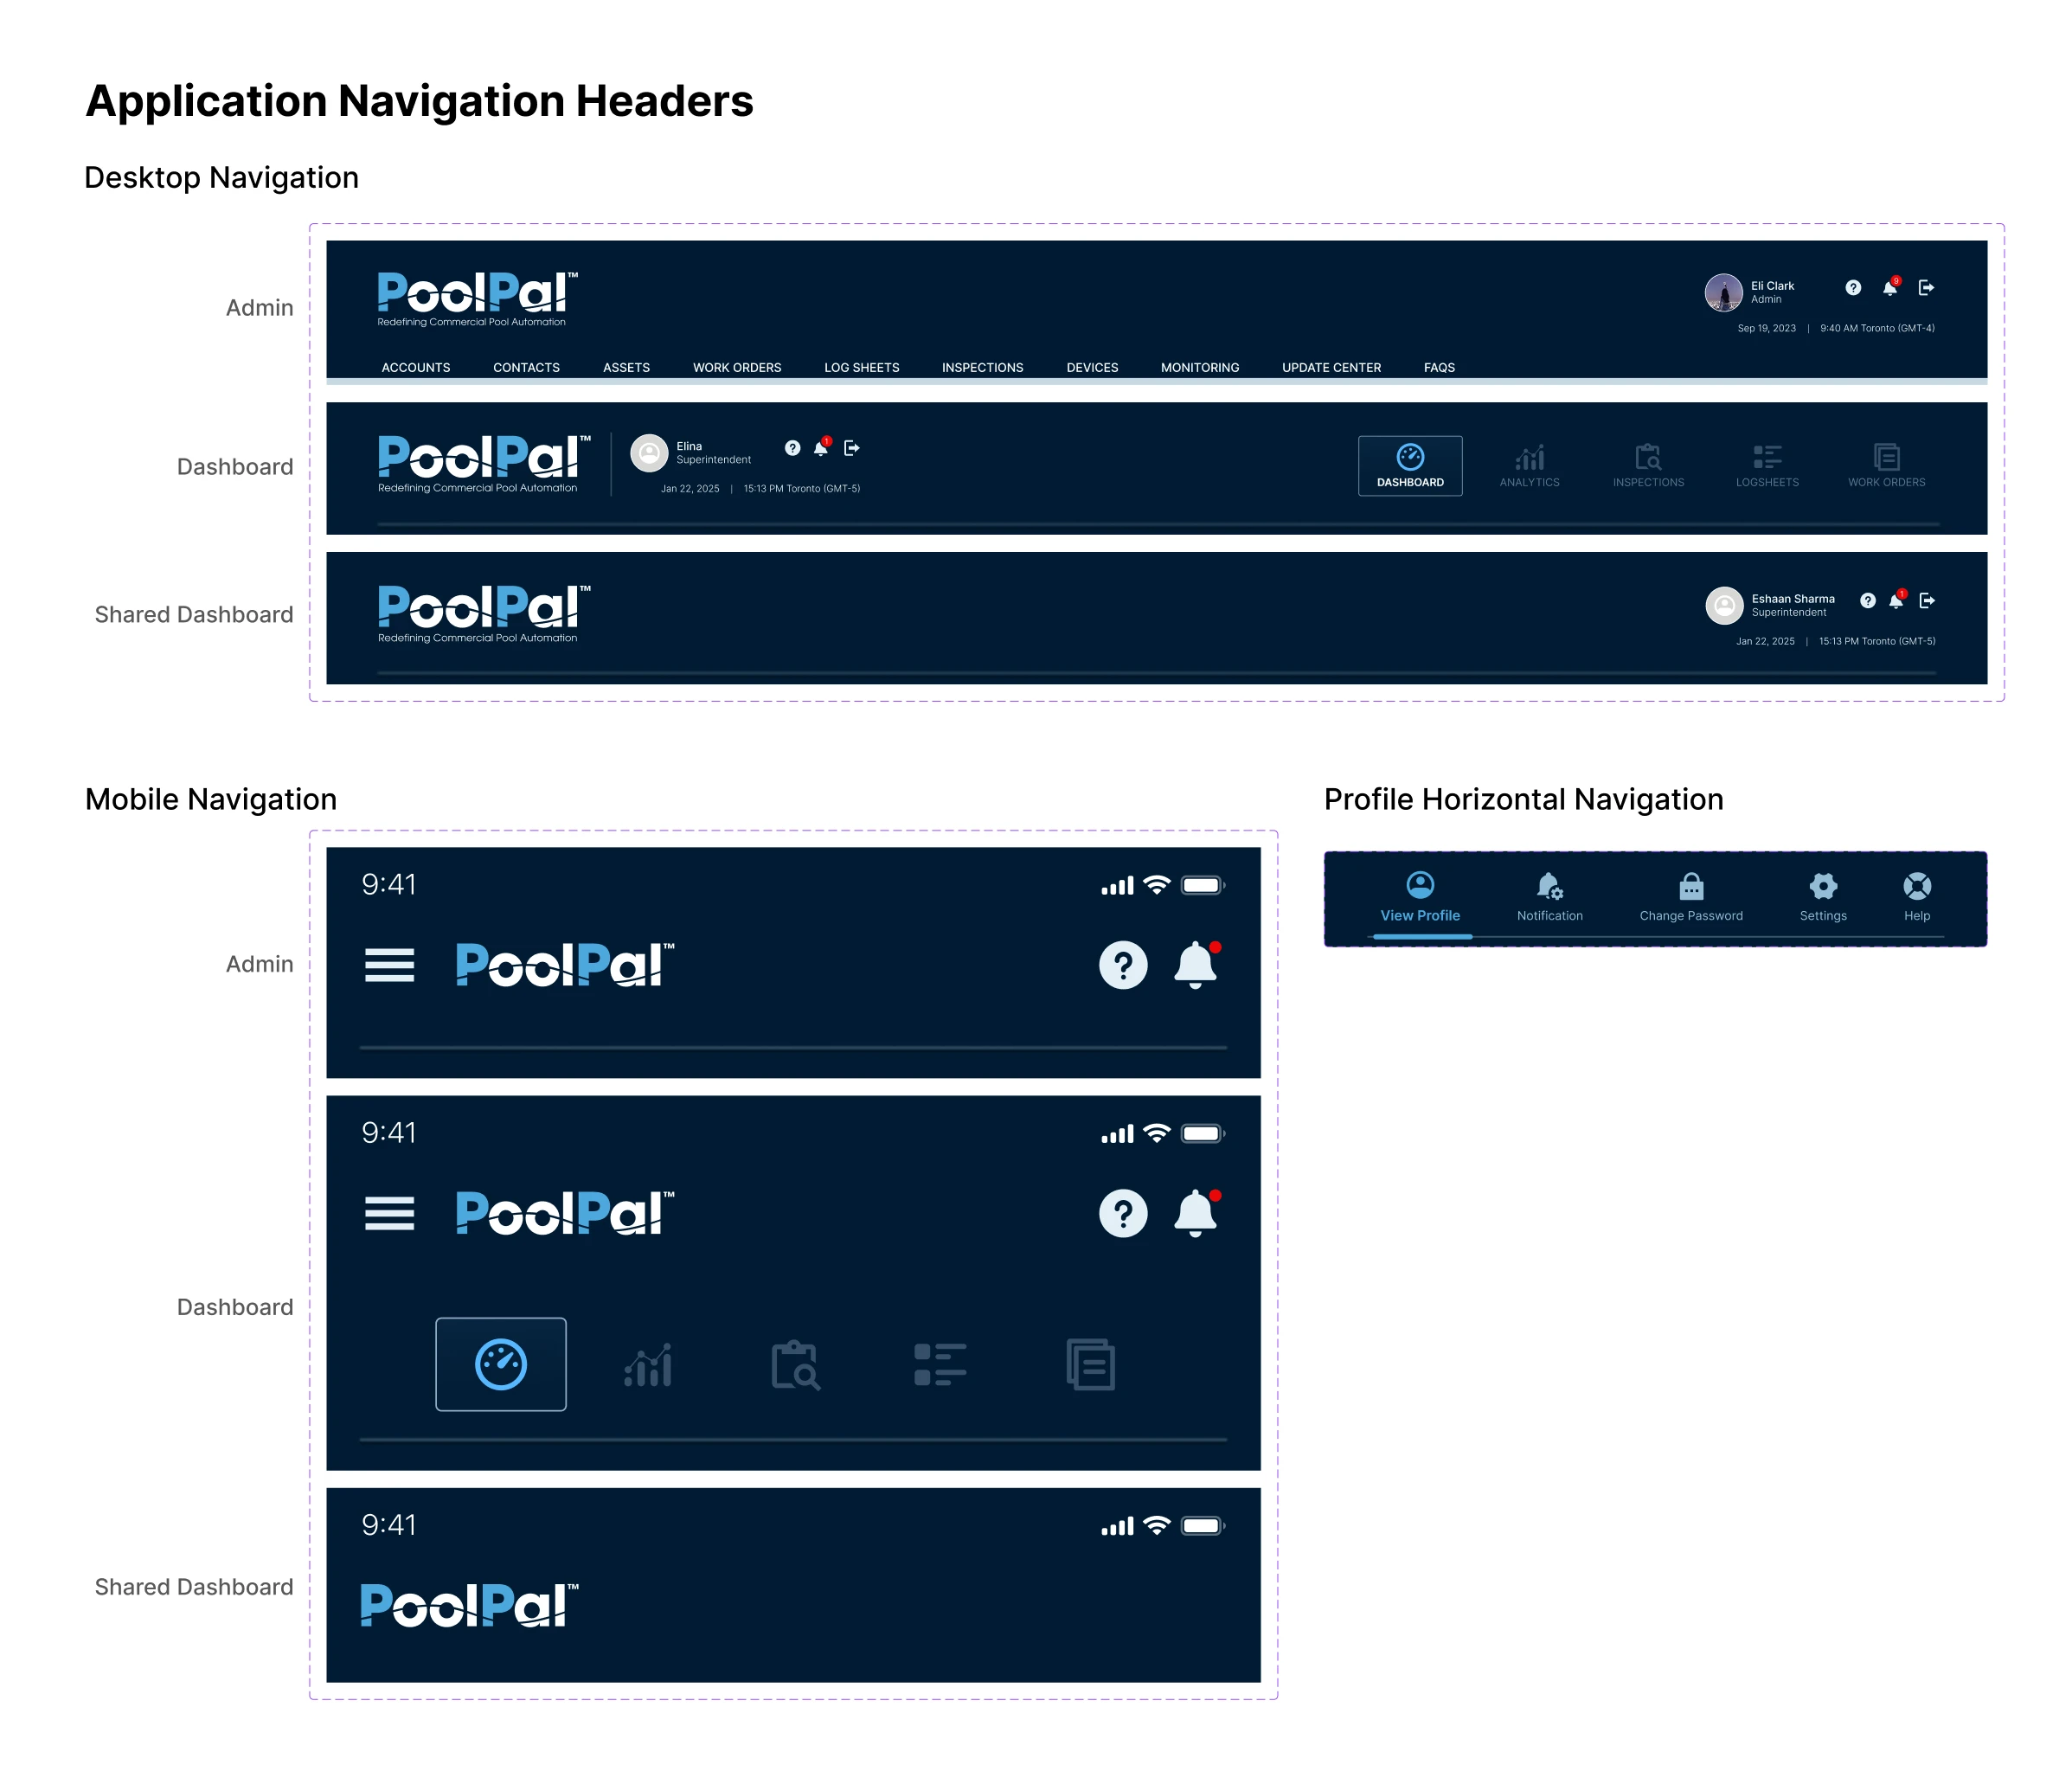
Dashboard & Admin Experience
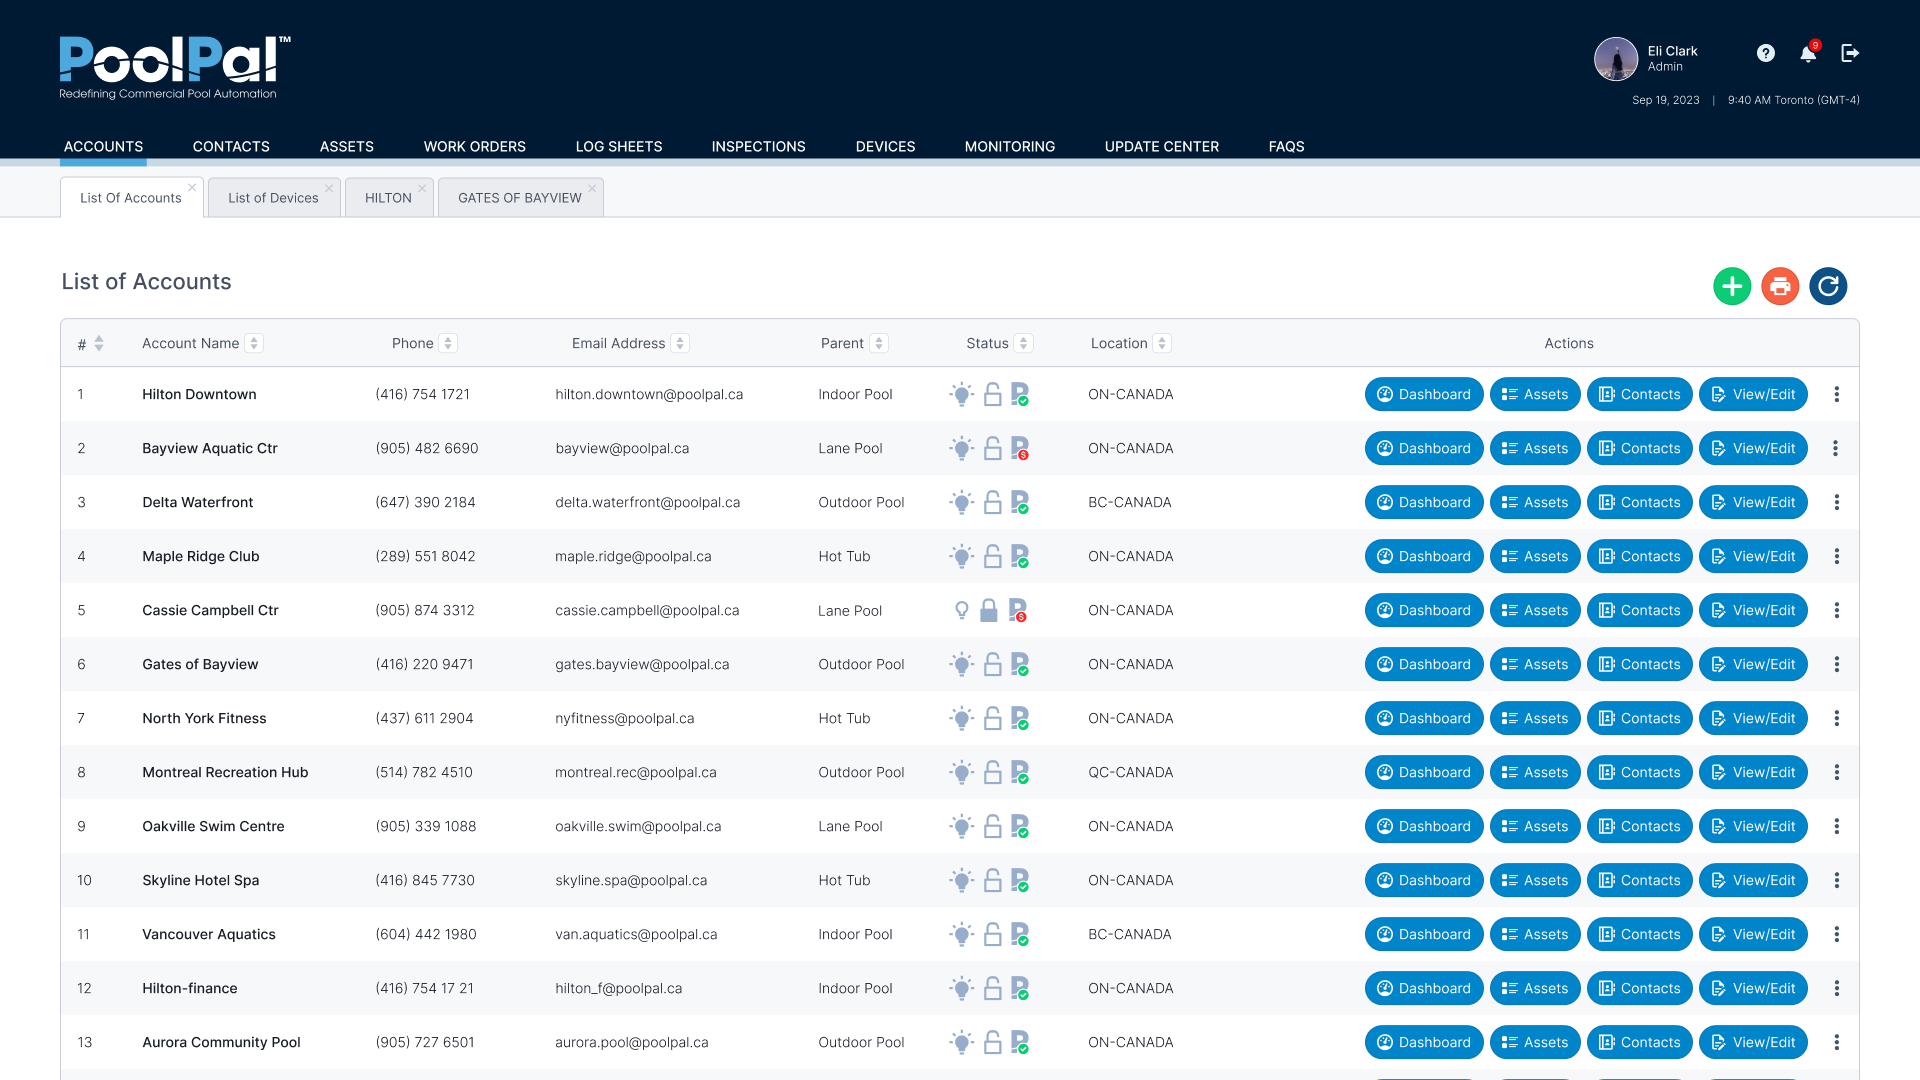
Admin Management Layer
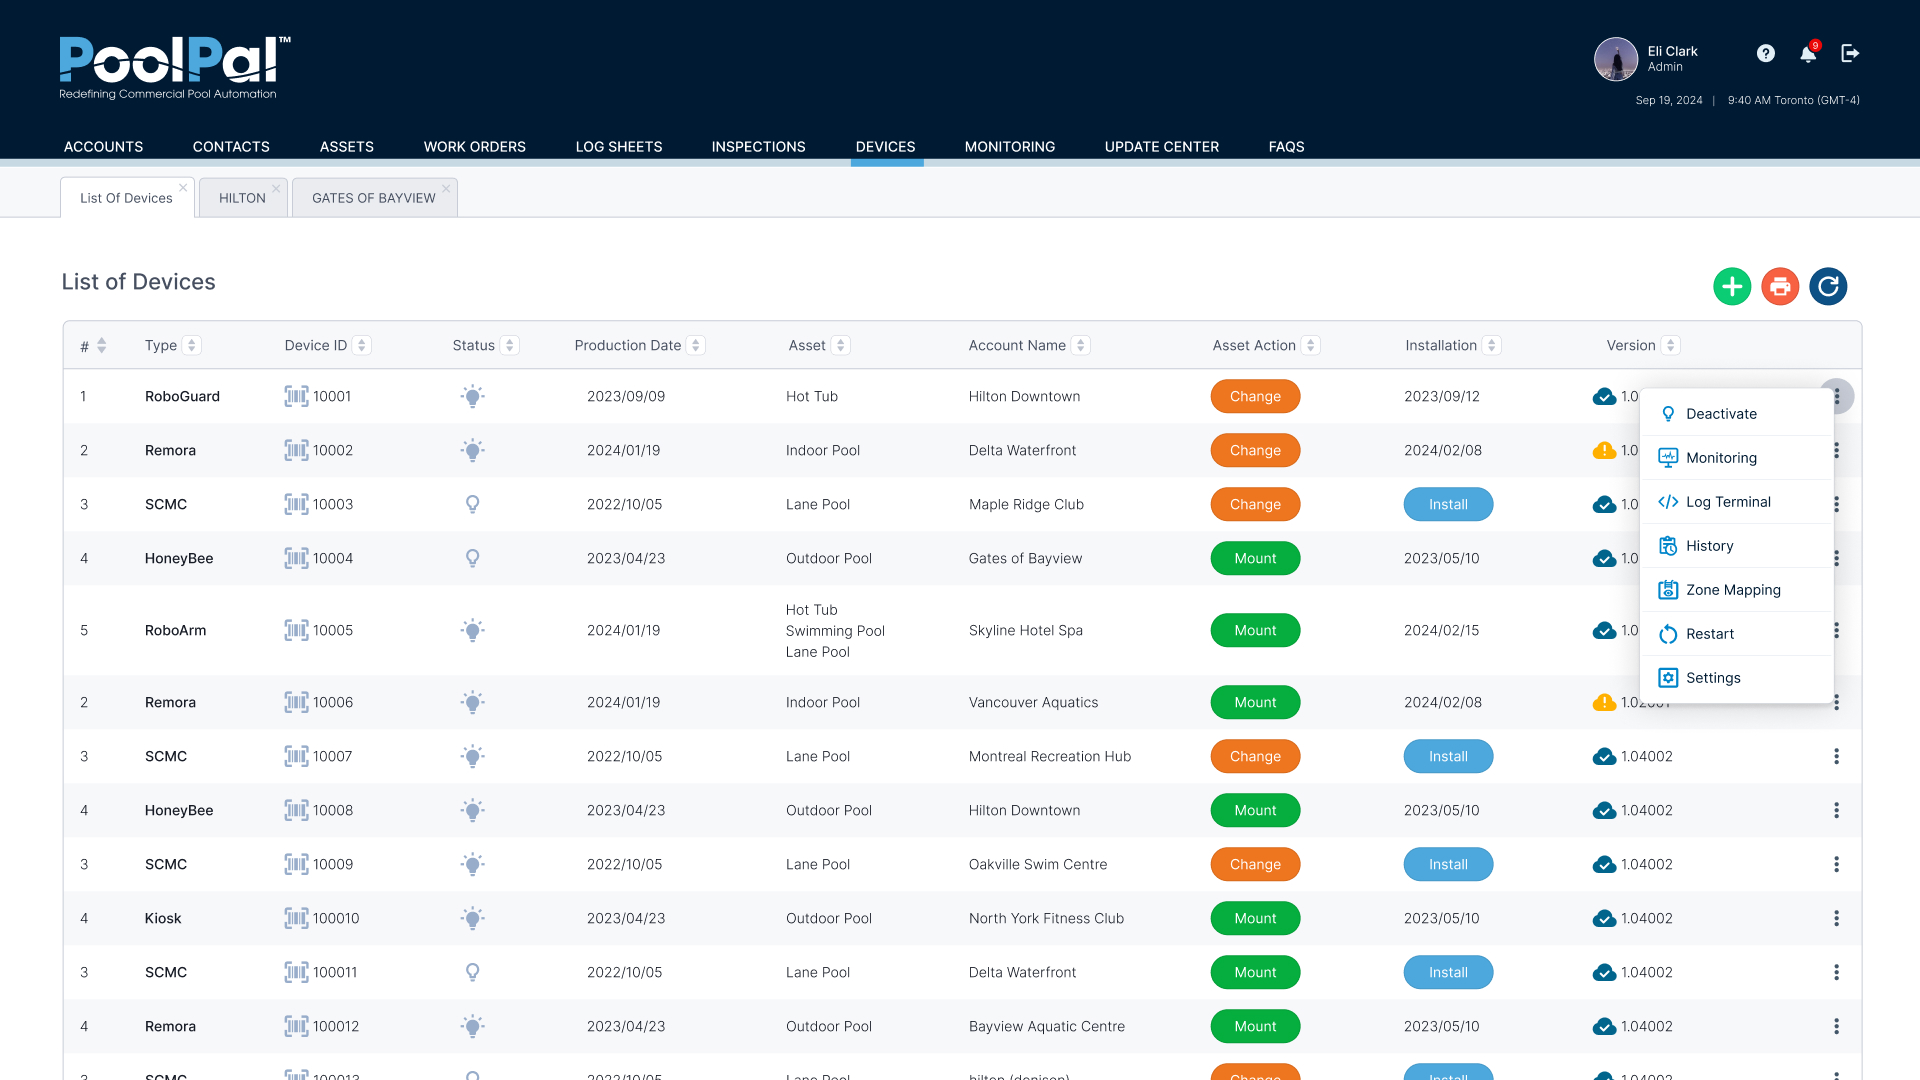
I structured the admin side of the platform around the system’s main management objects: accounts, contacts, assets, connected devices, work orders, log sheets, monitoring, and software updates.
Because this environment supported setup, oversight, troubleshooting, and operational coordination across multiple properties, I designed it as a scalable, table-driven system with direct access to related assets, dashboards, device actions, and issue tracking.
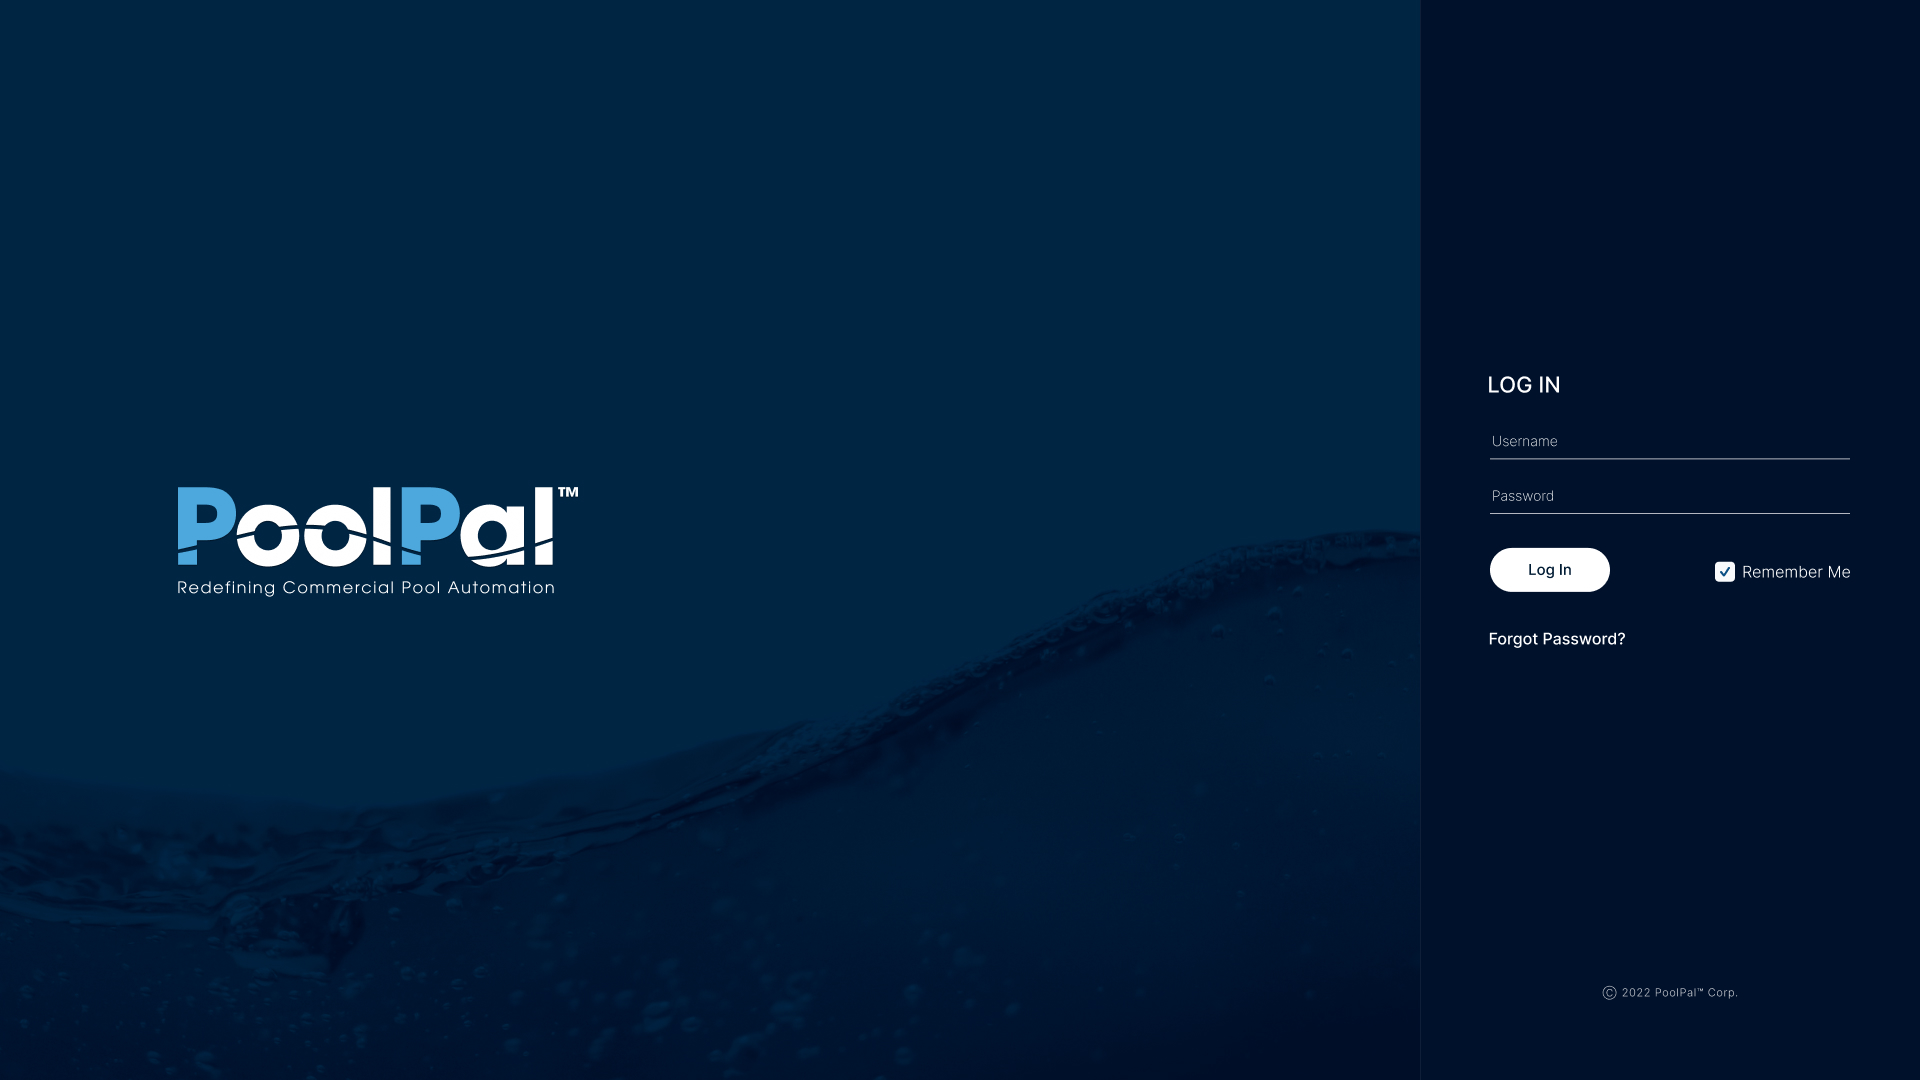
Secure Access
Account Management
Asset & Device Assignment
Technical Diagnostics
Connected Device Management
Centralized Monitoring
Operational Log Sheets
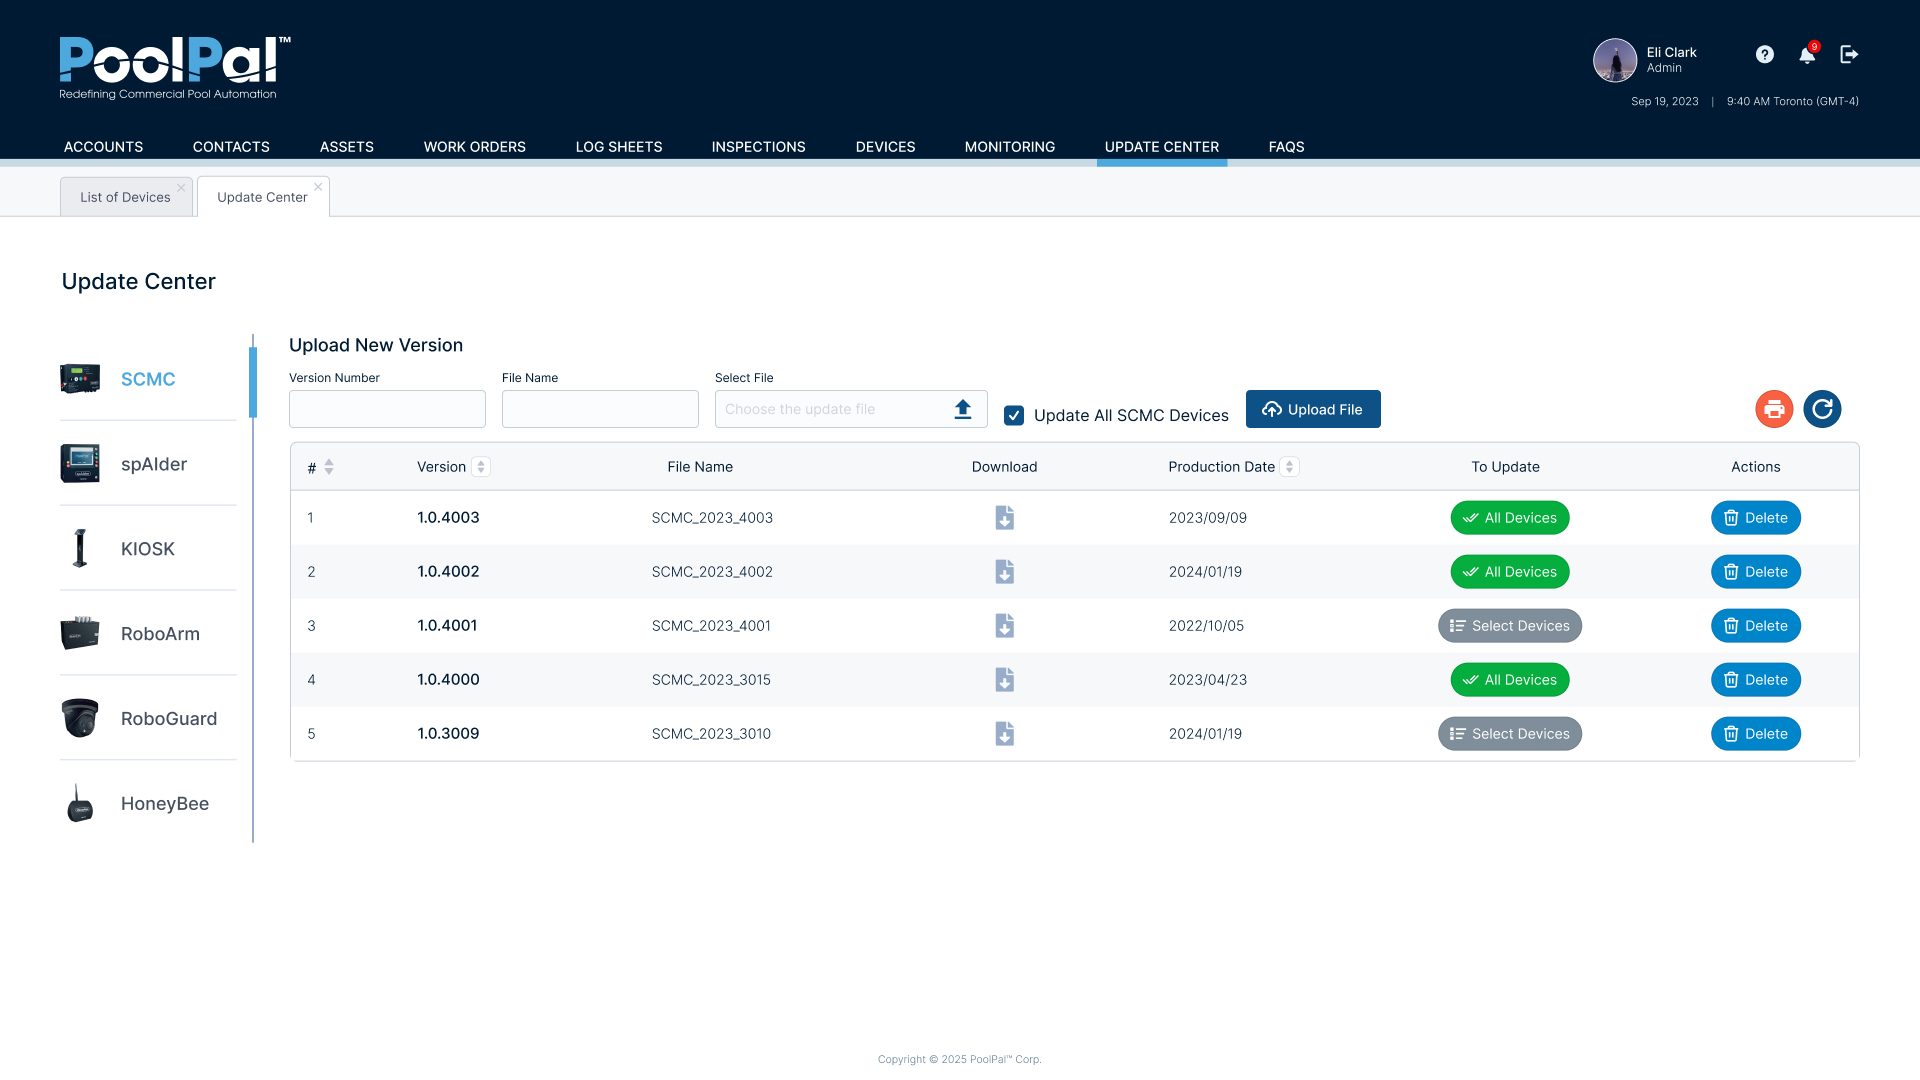
Software Update Management
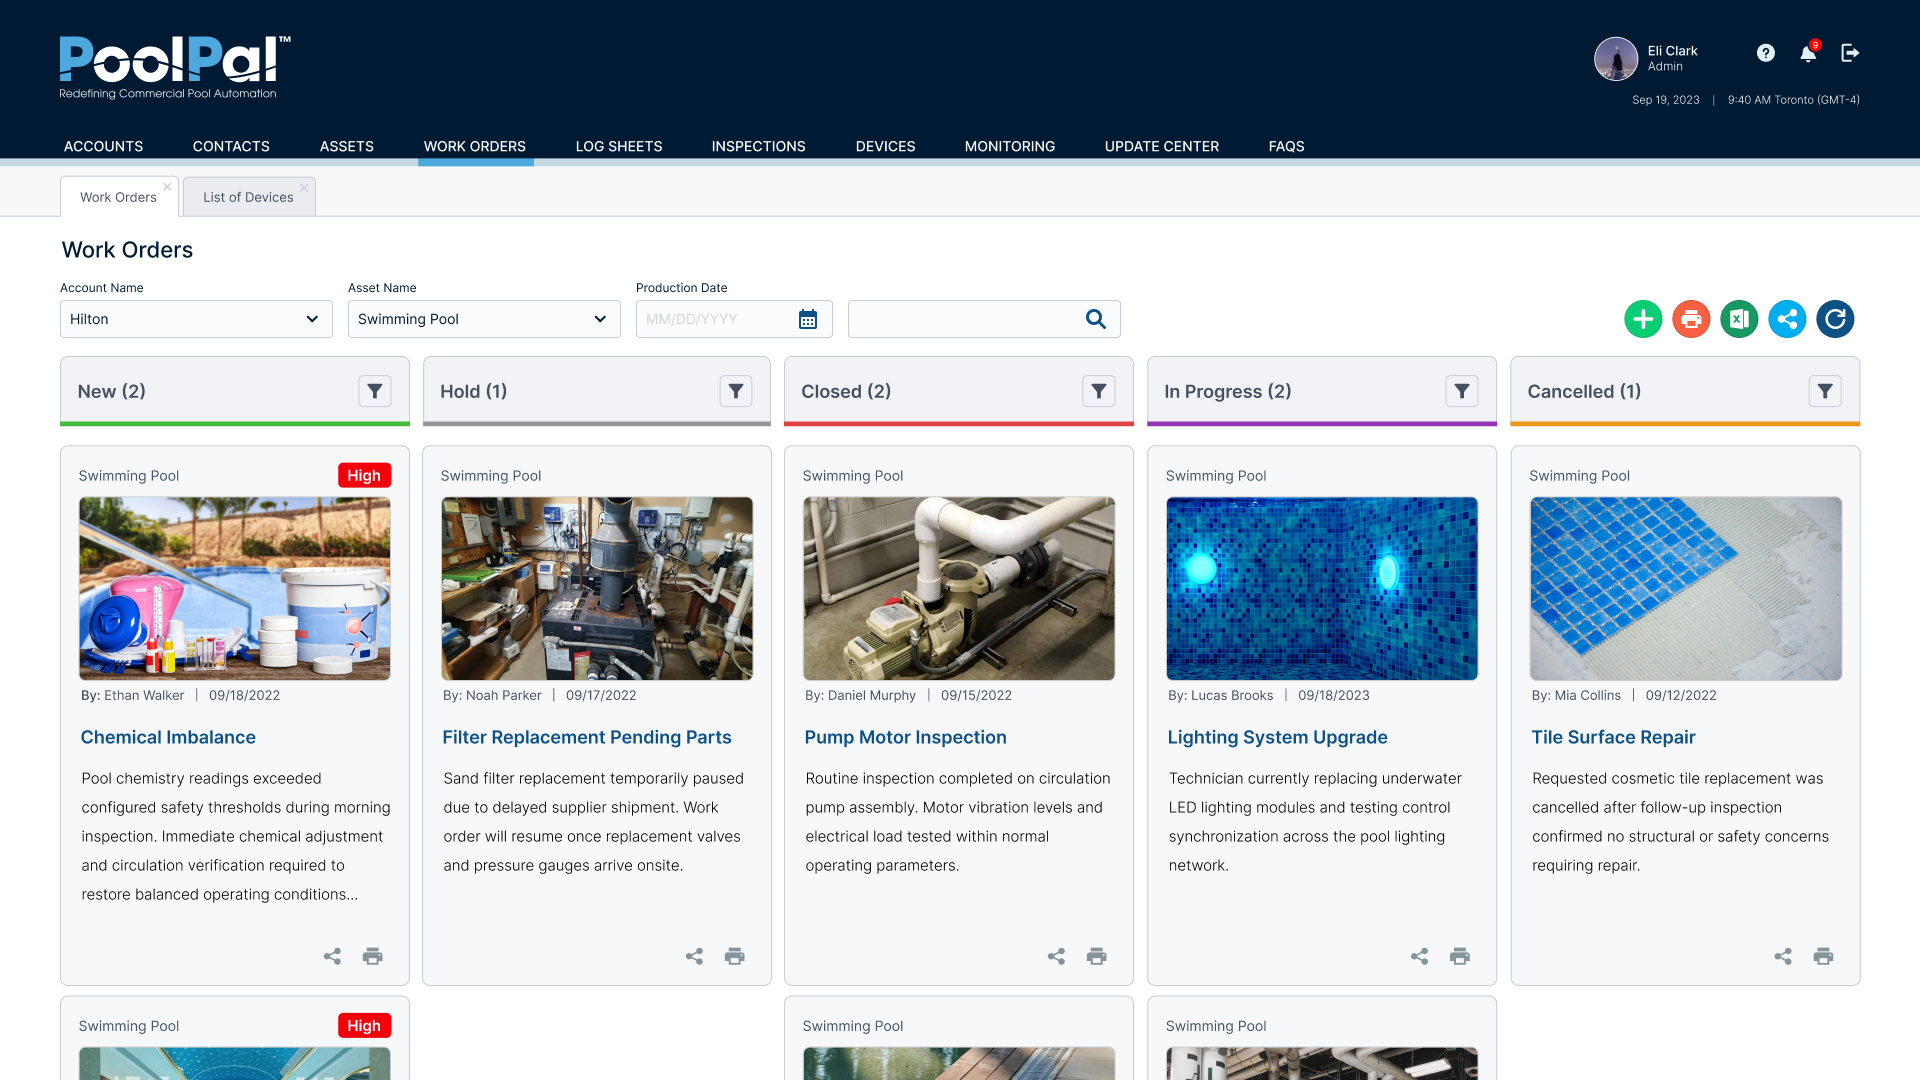
Work Order Tracking
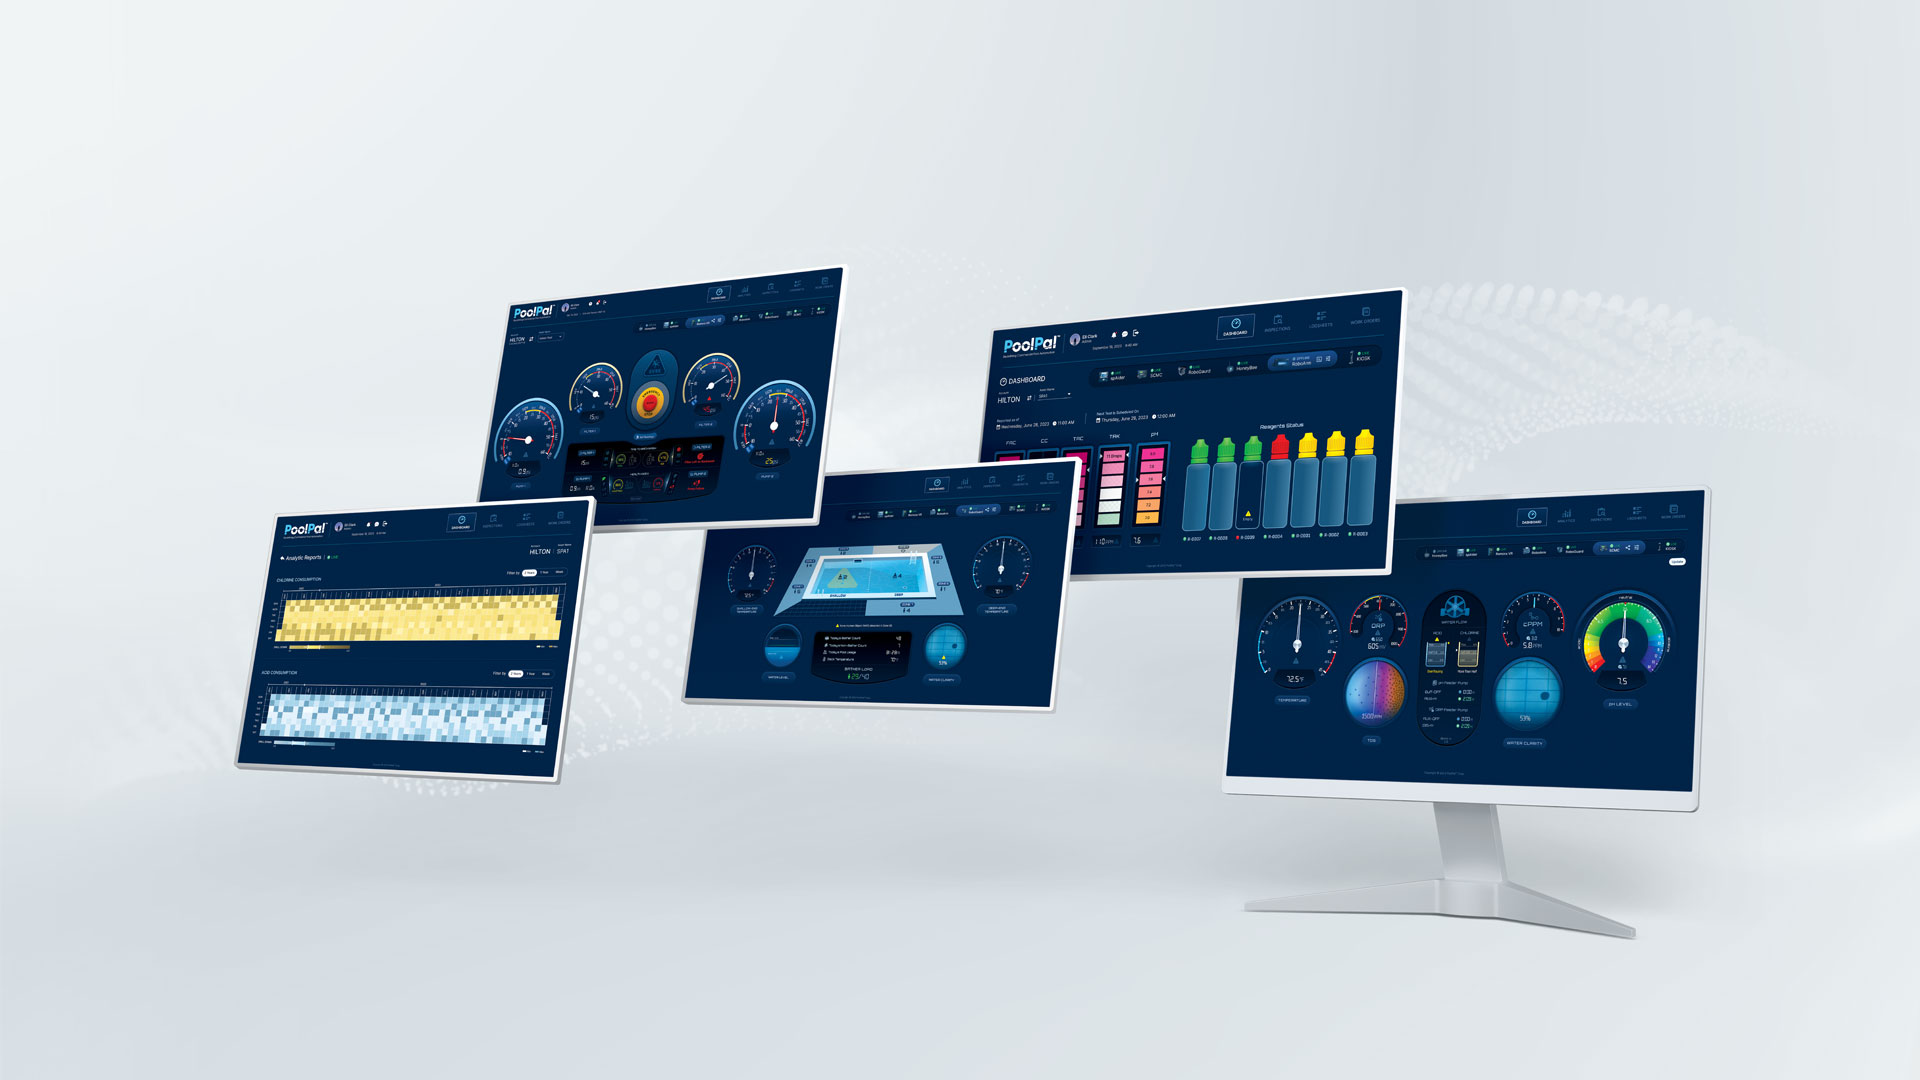
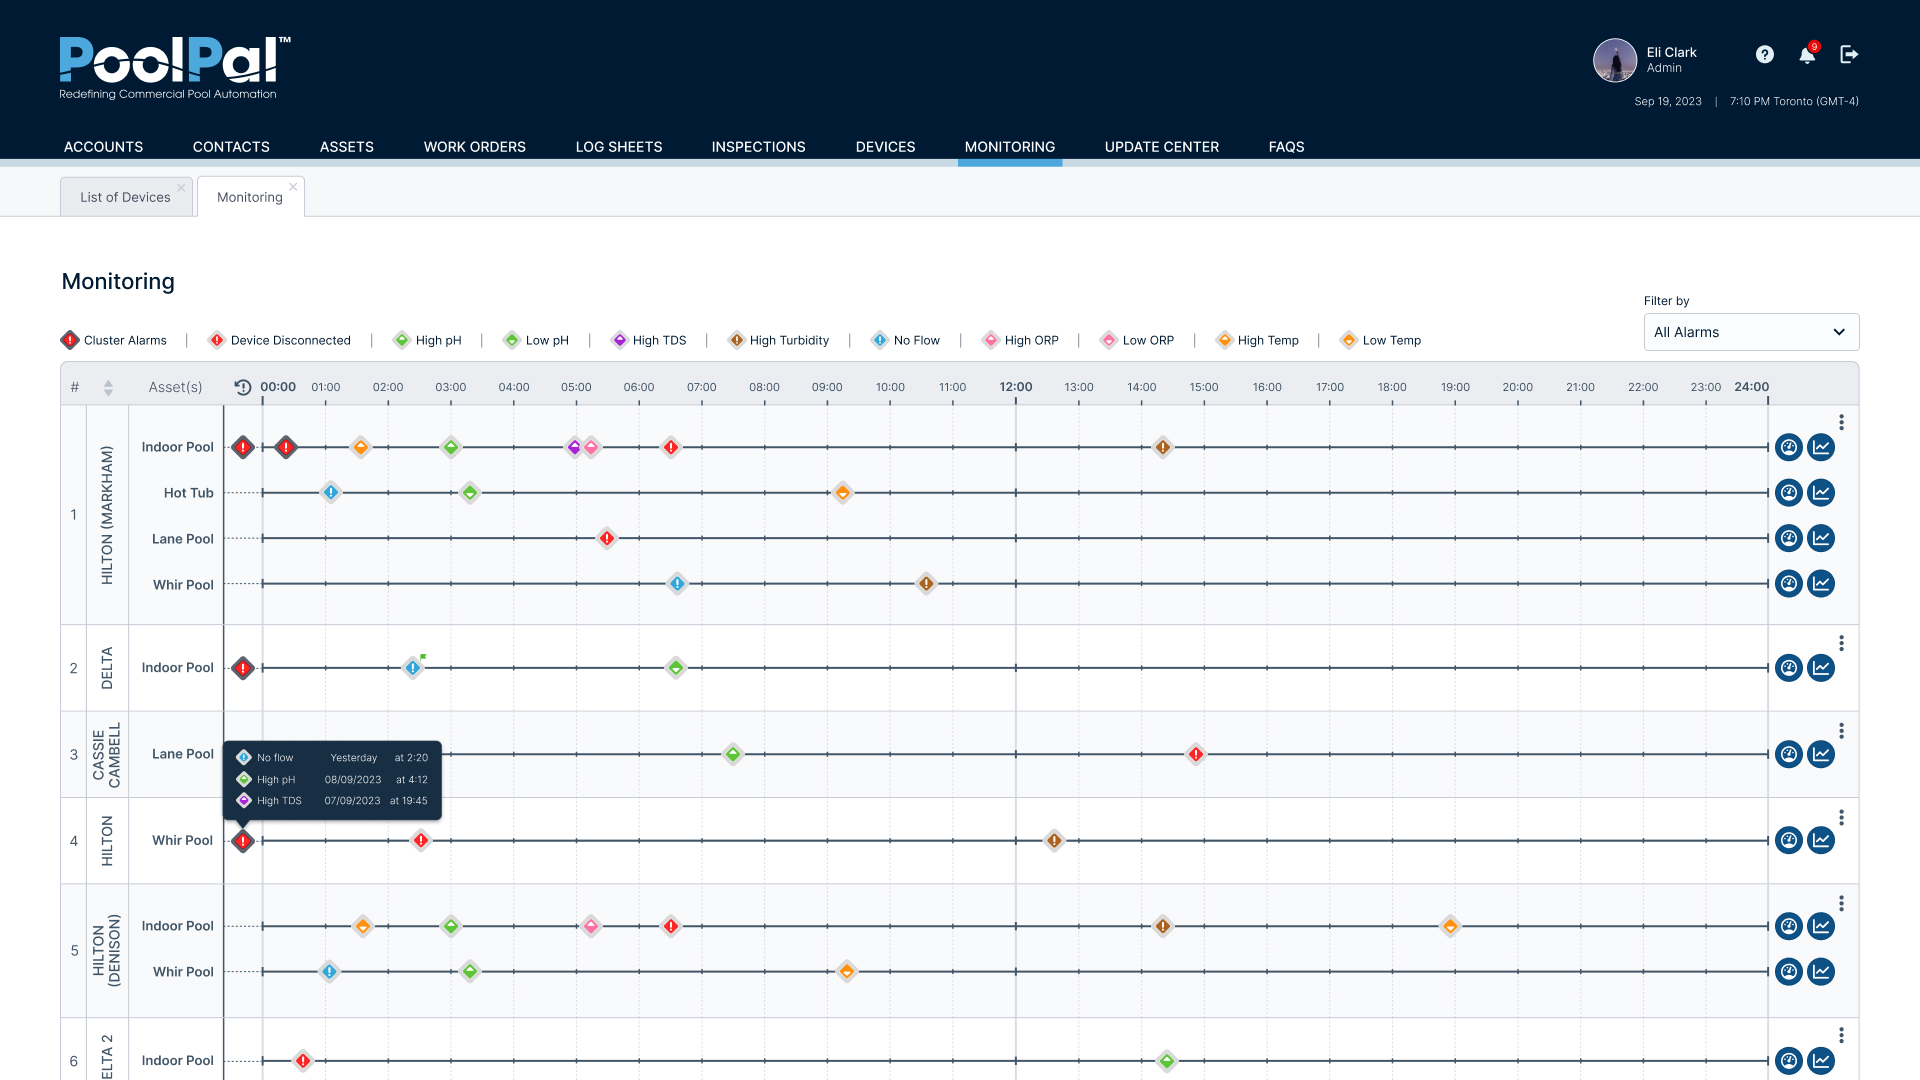
Real-Time Operational Dashboards
For the operational side of the platform, I designed a dashboard system that allowed users to monitor live conditions and switch between connected devices within the selected account and asset context.
Each device required its own data, alerts, and operational logic, so I created specialized dashboard views while maintaining a consistent navigation structure and visual language across the product.
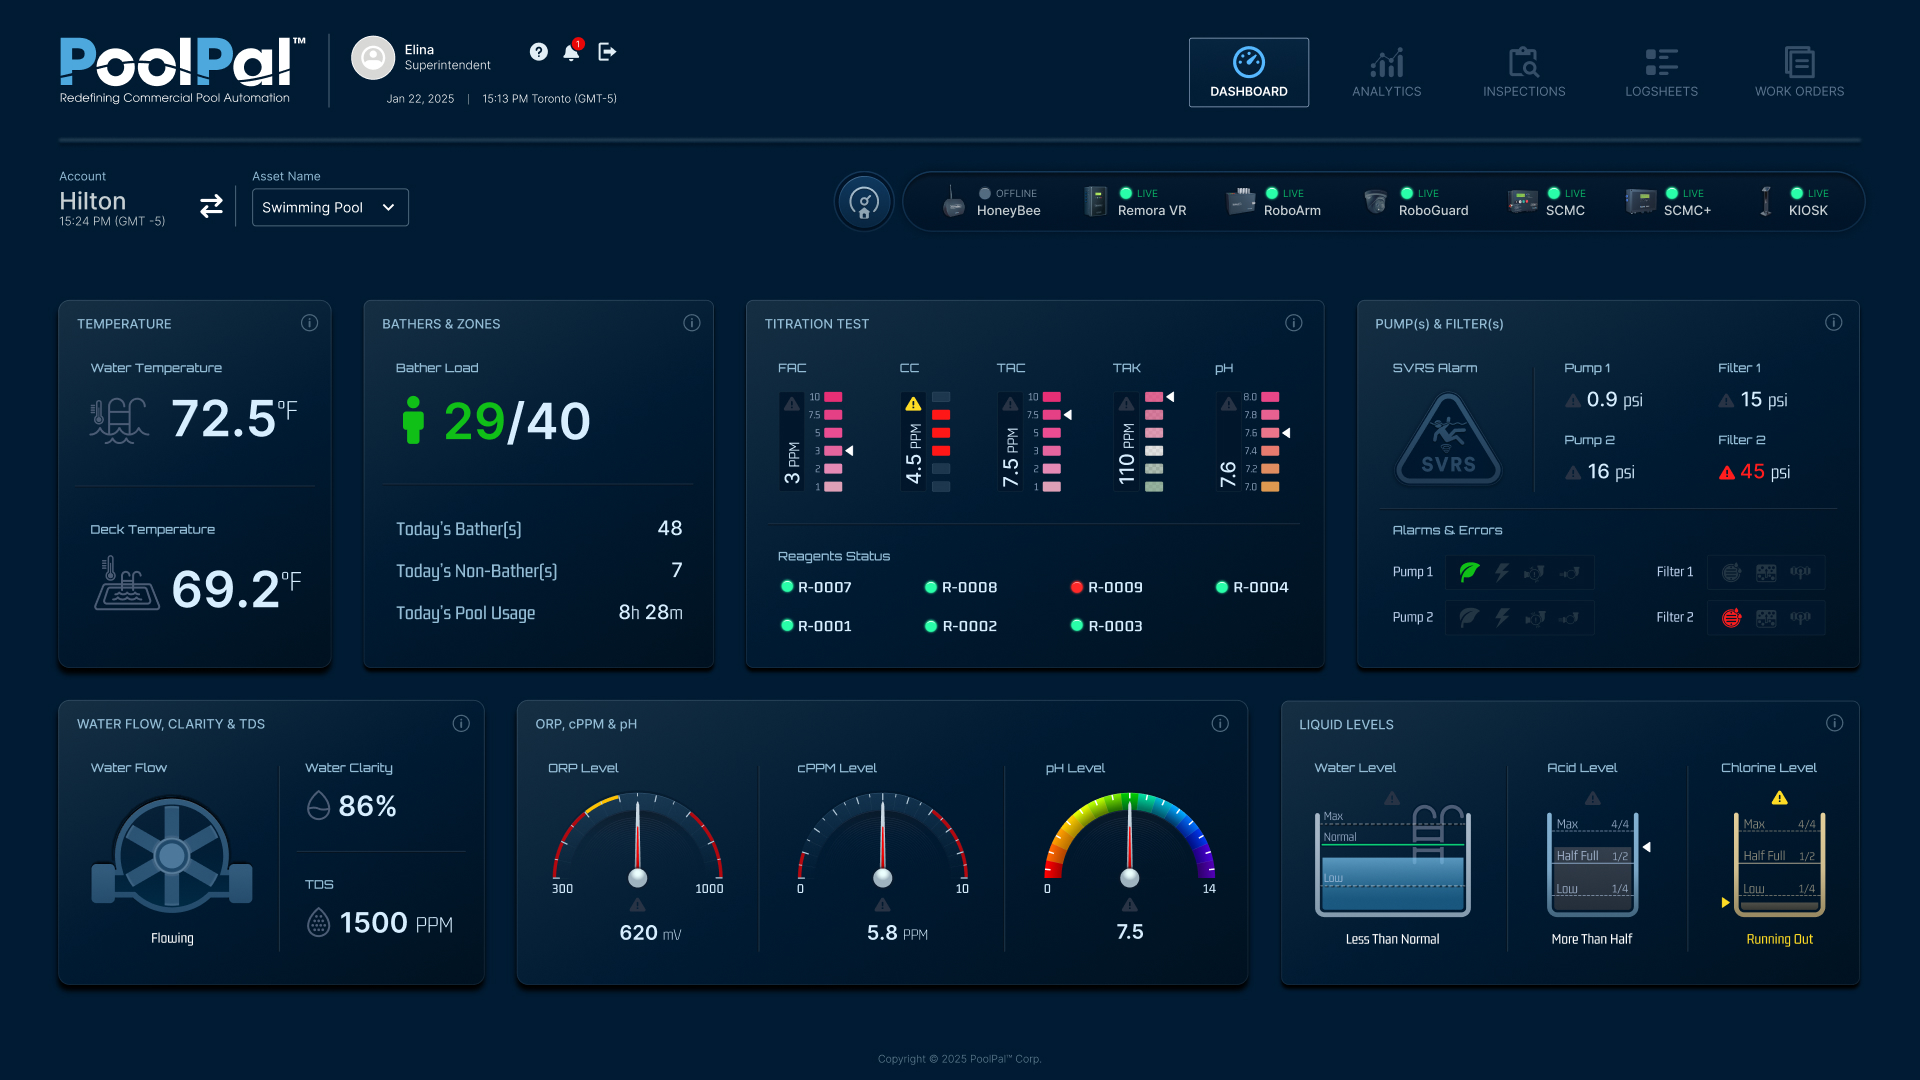
General Operations Dashboard
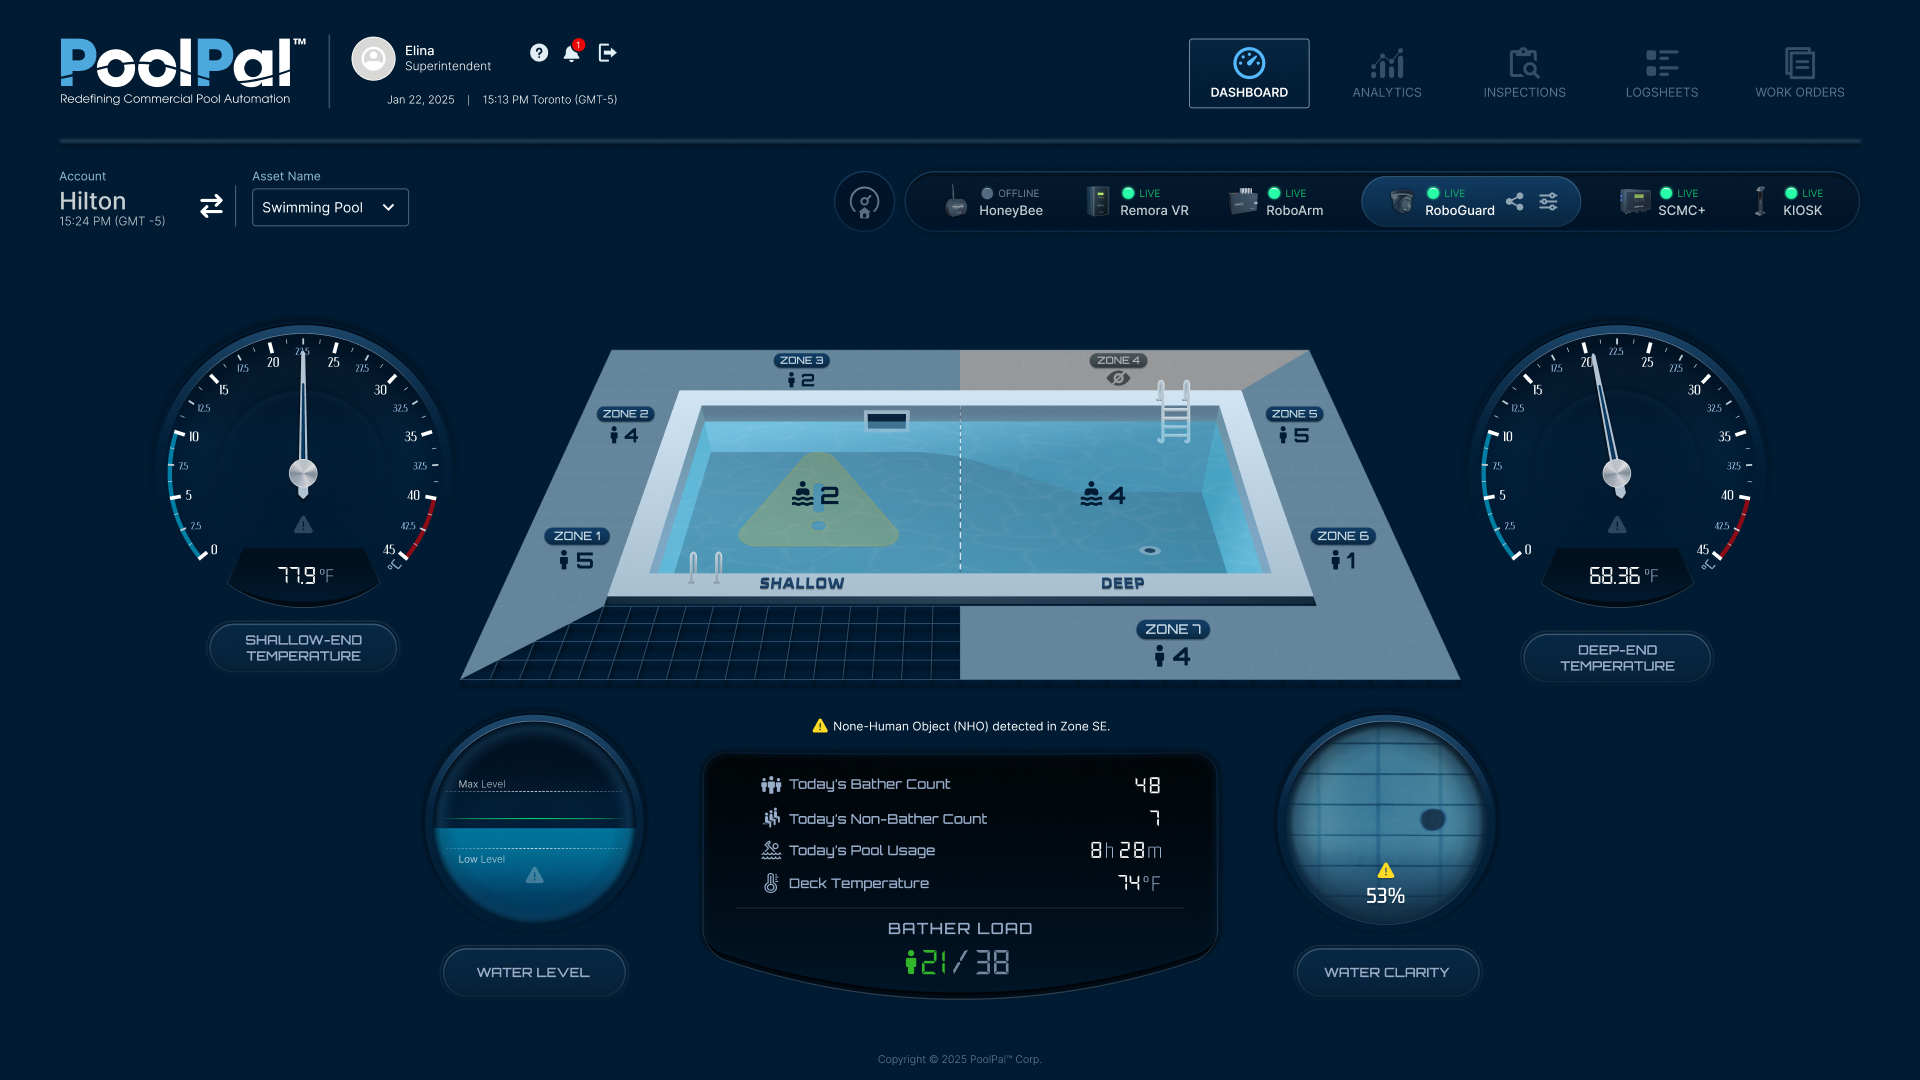
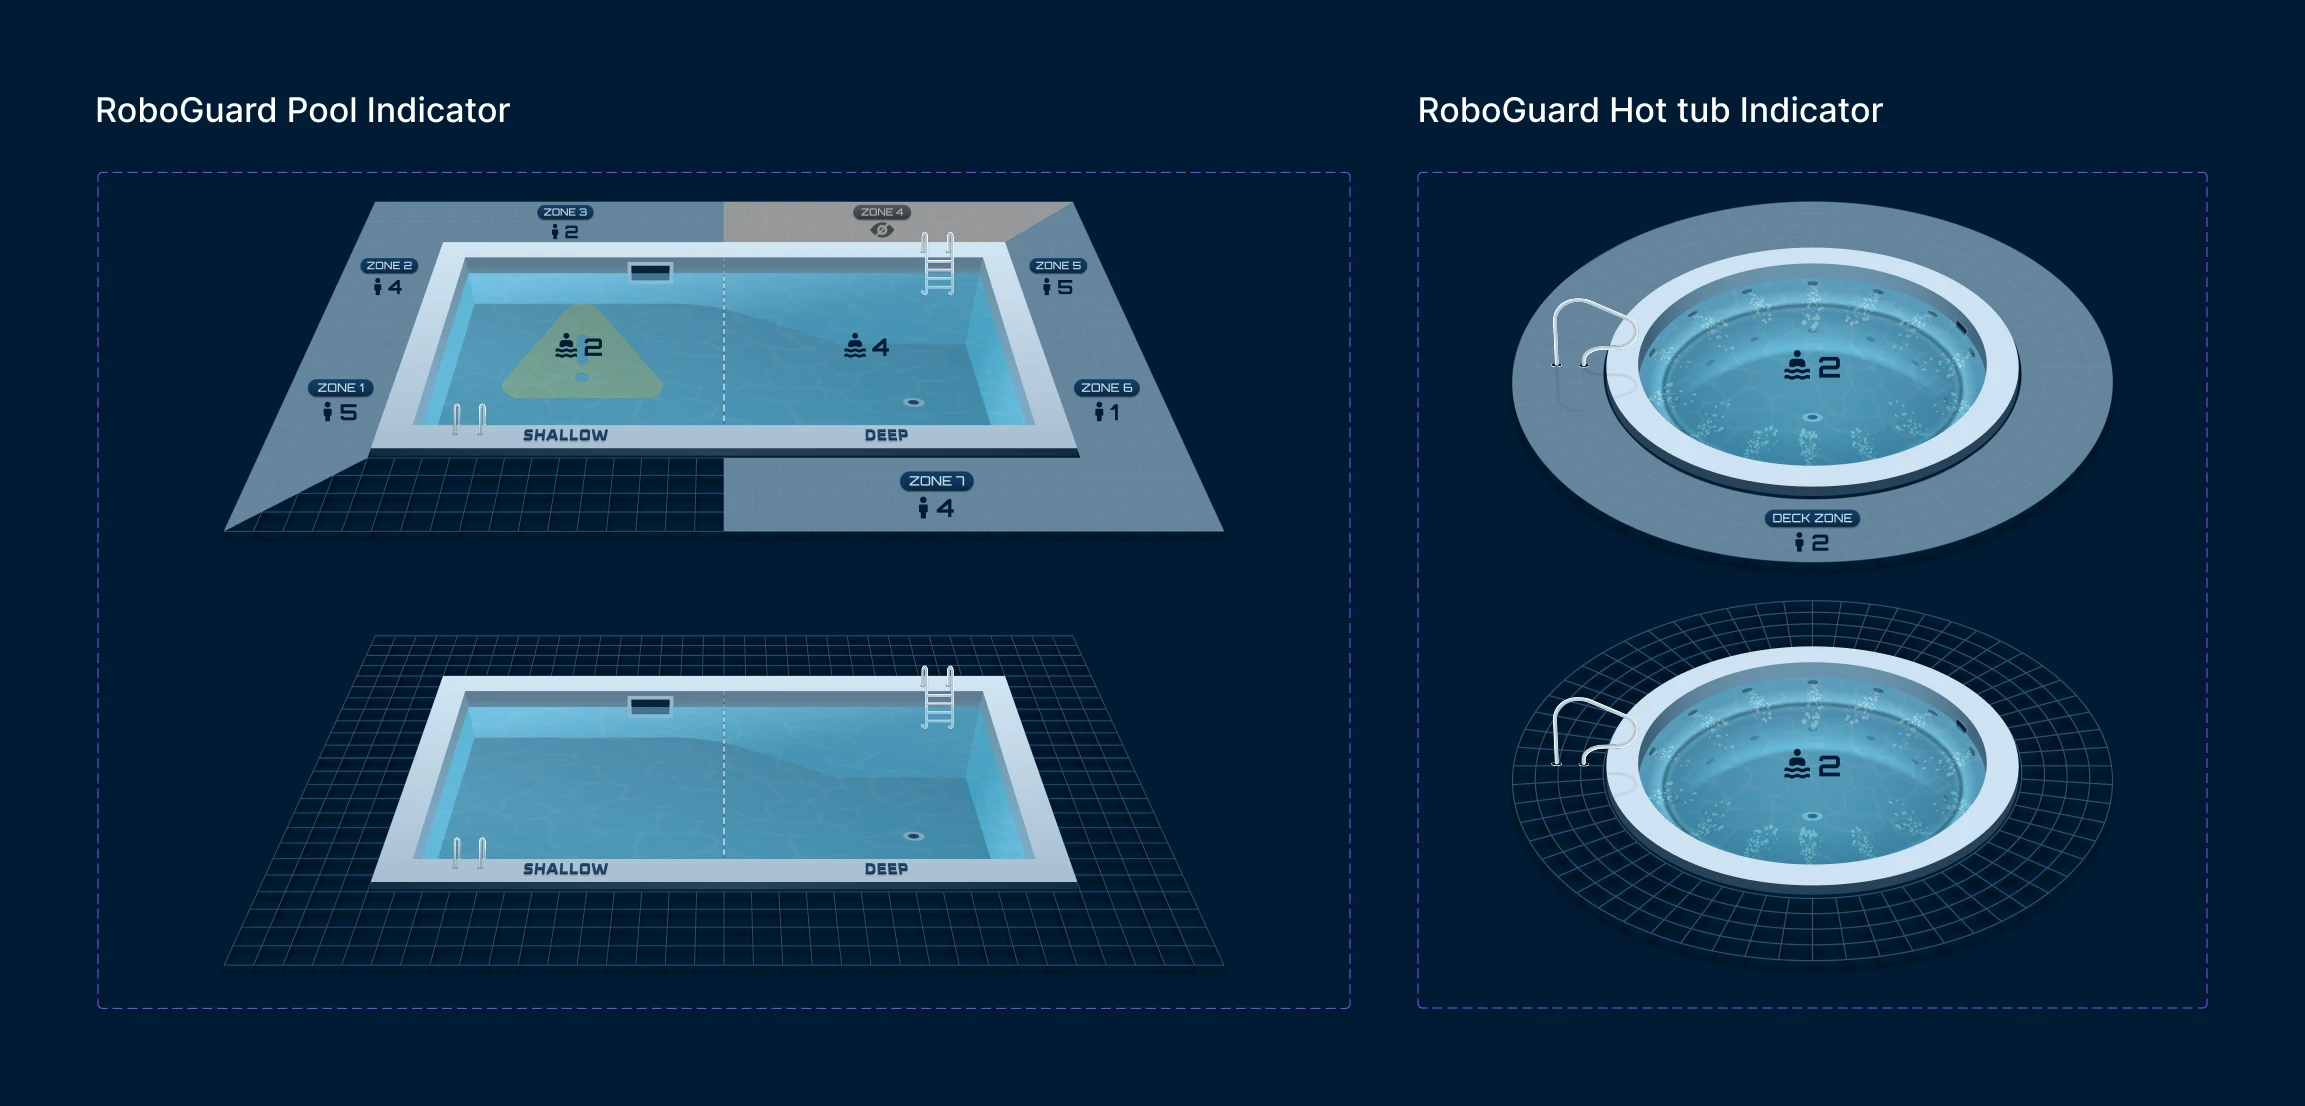
RoboGuard Dashboard - Pool Mode
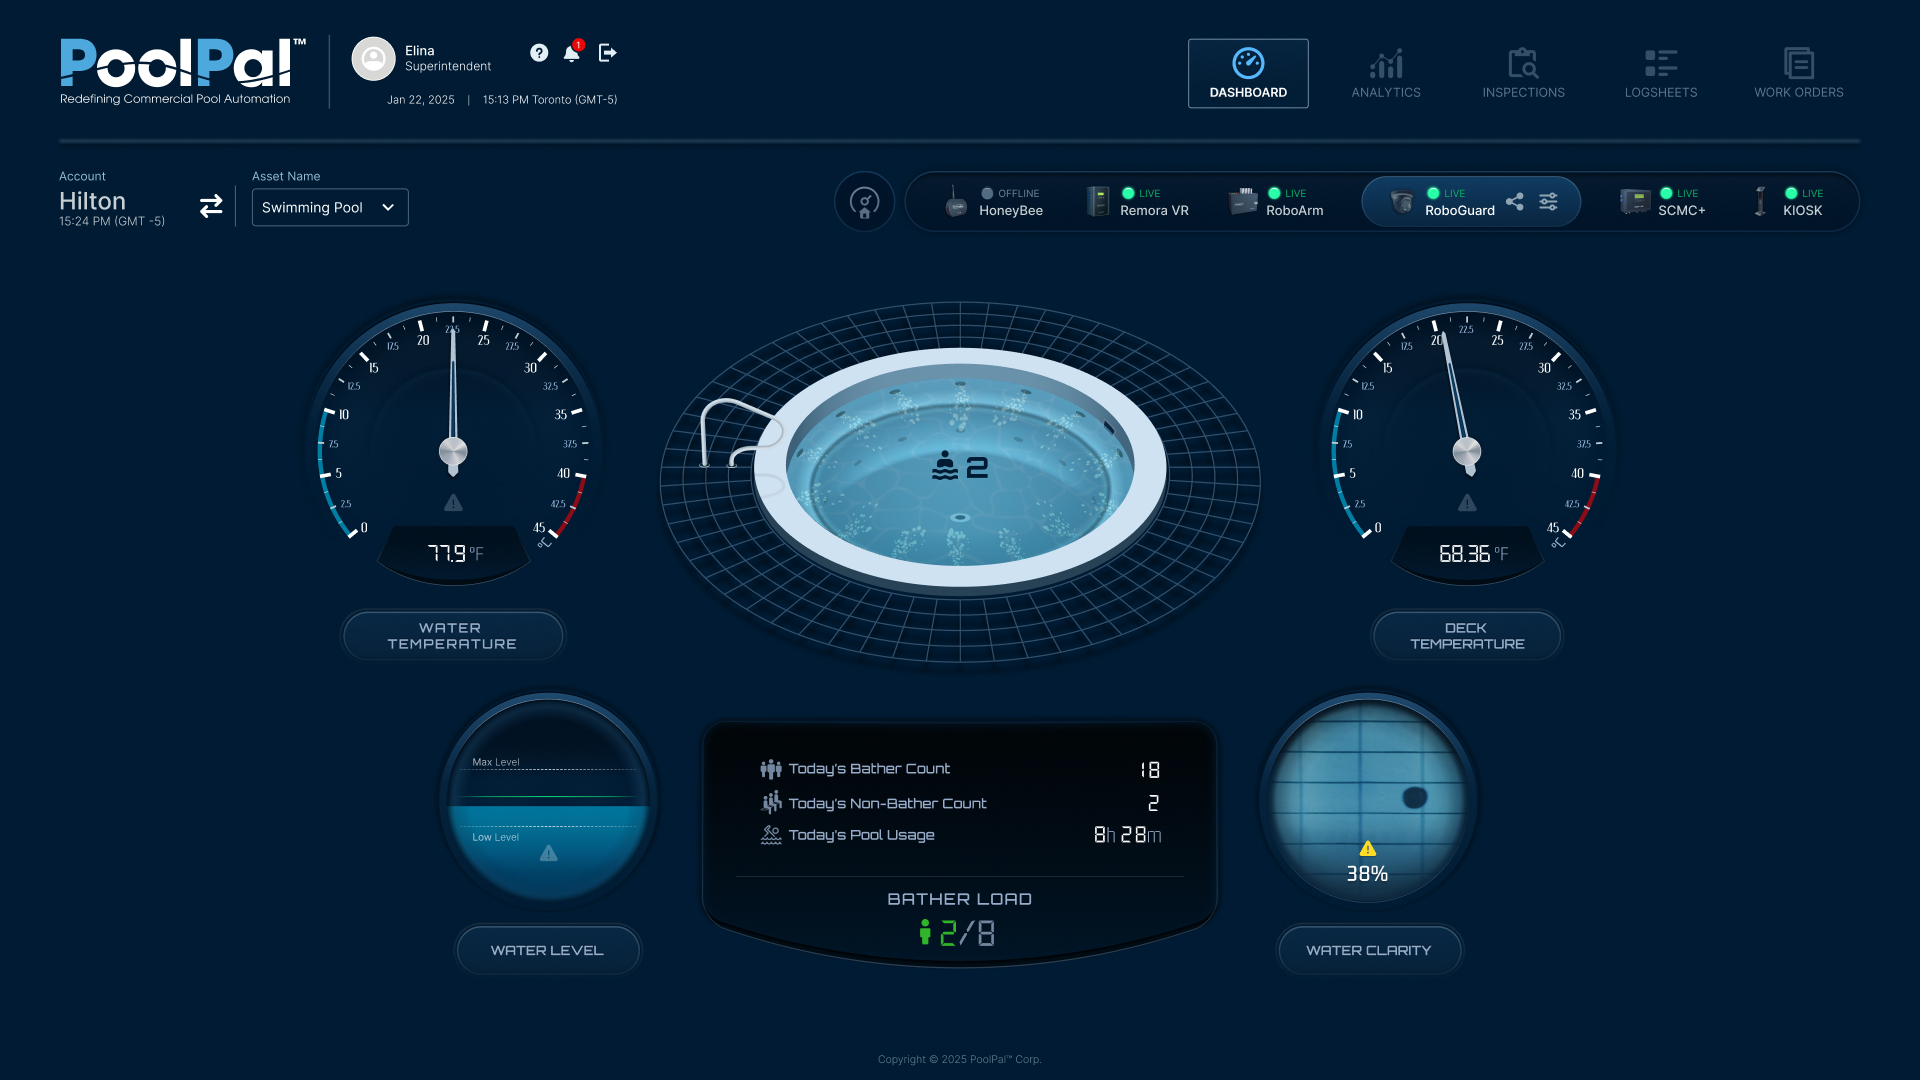
RoboGuard Dashboard - Hot Tub Mode
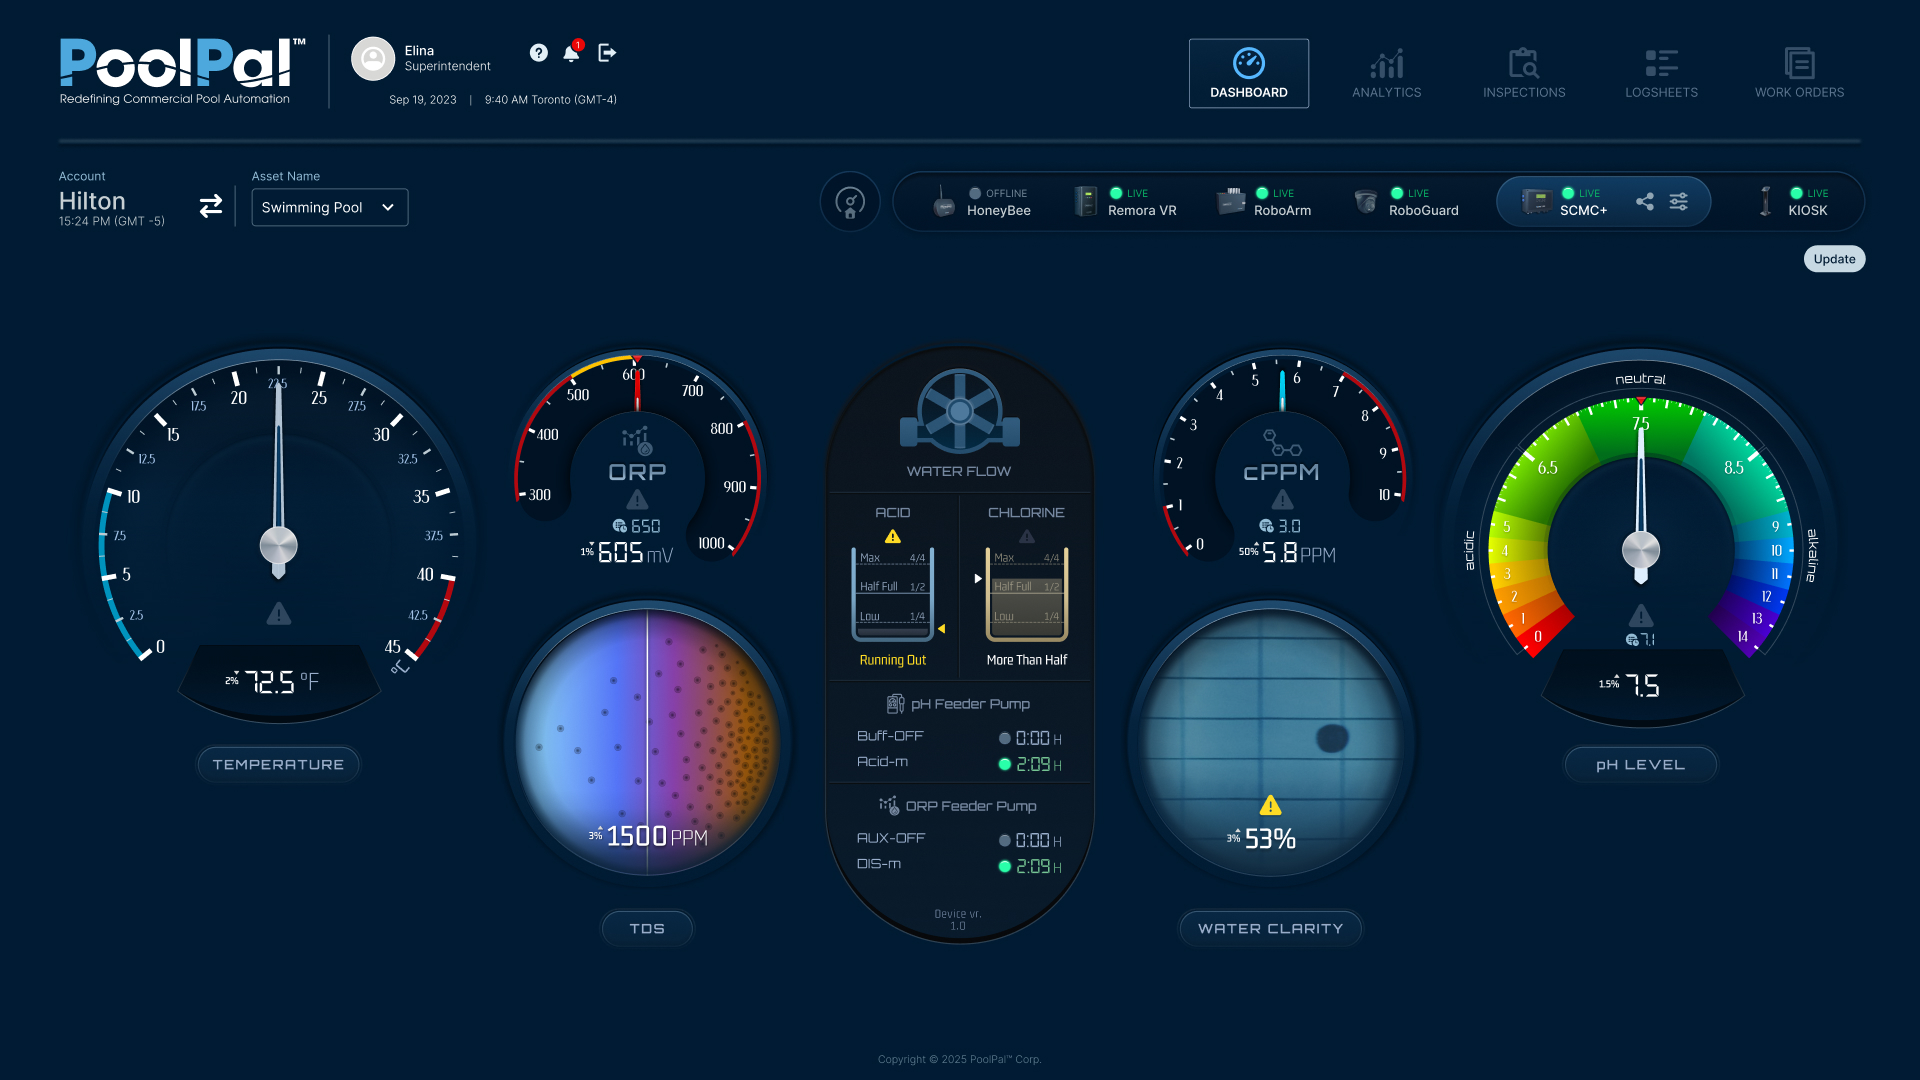
SCMC+ Dashboard
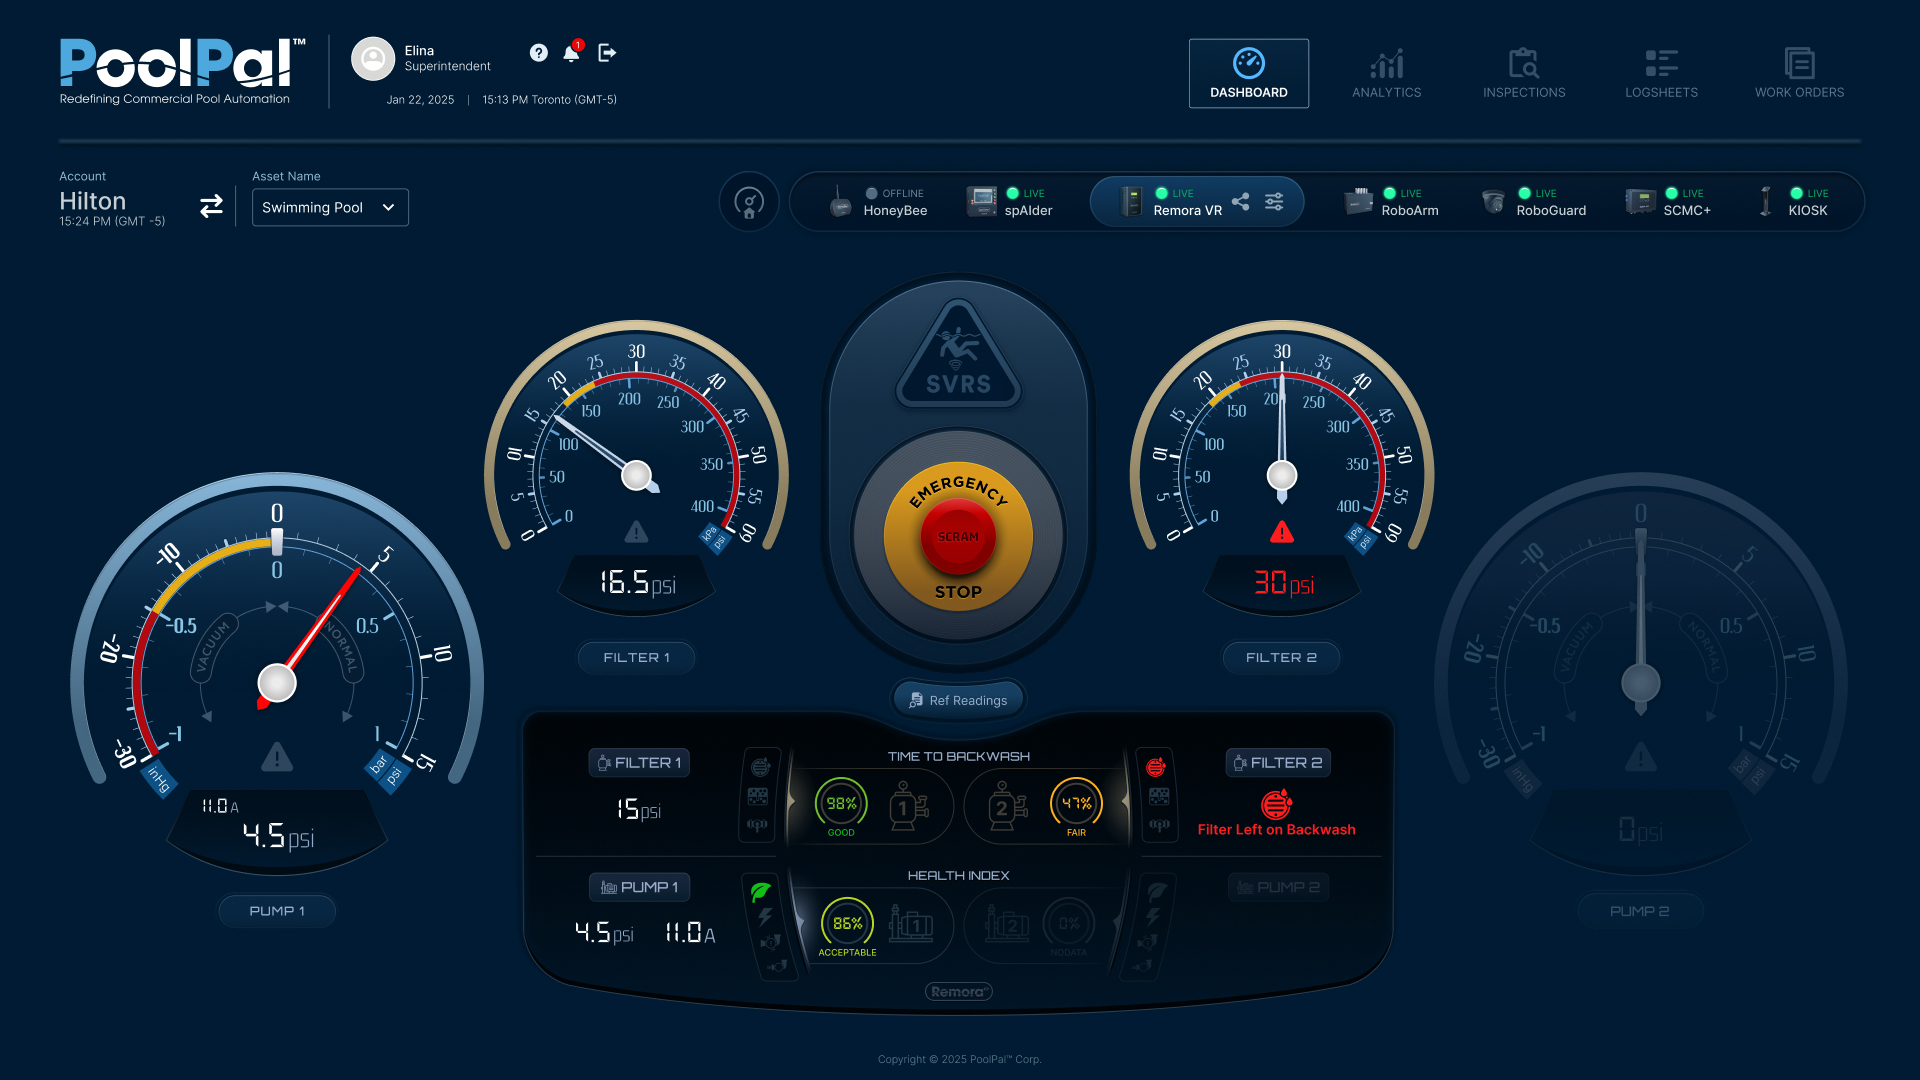
RemoraVR Dashboard
RoboArm Dashboard
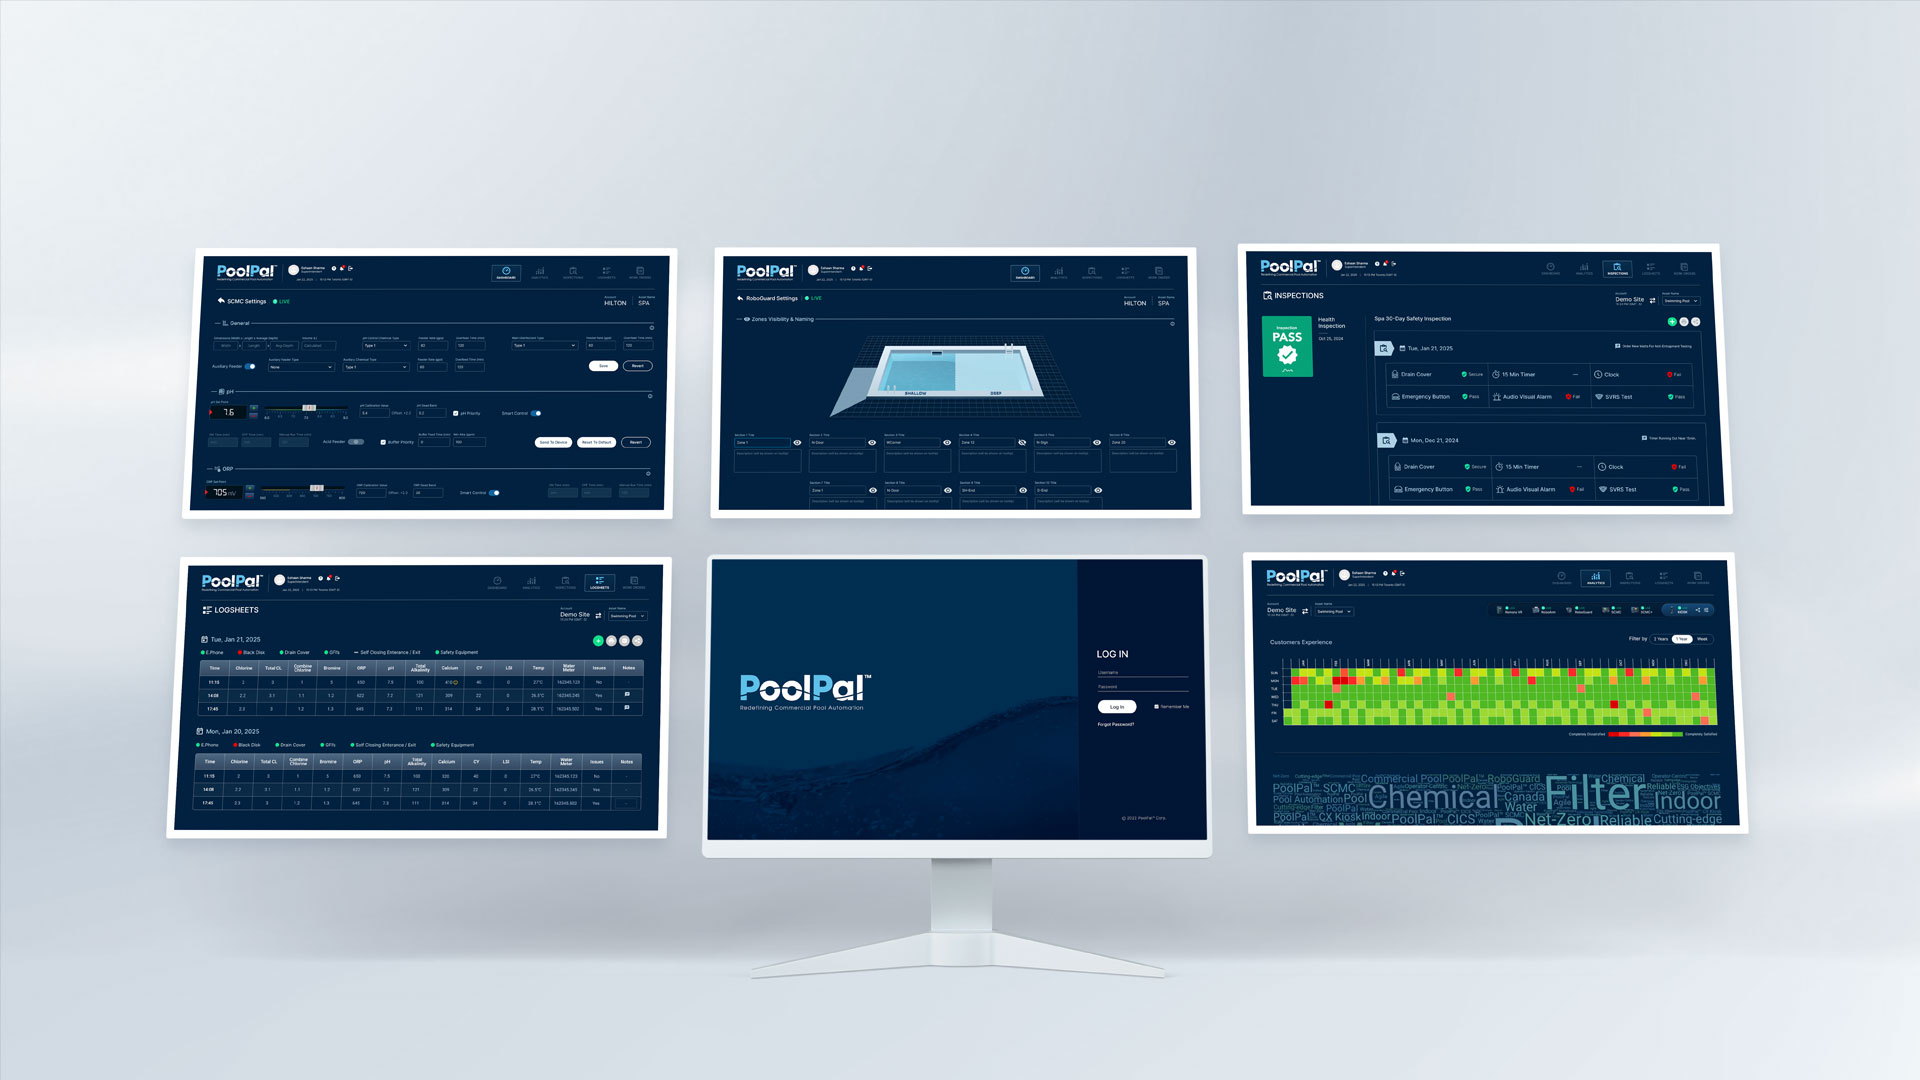
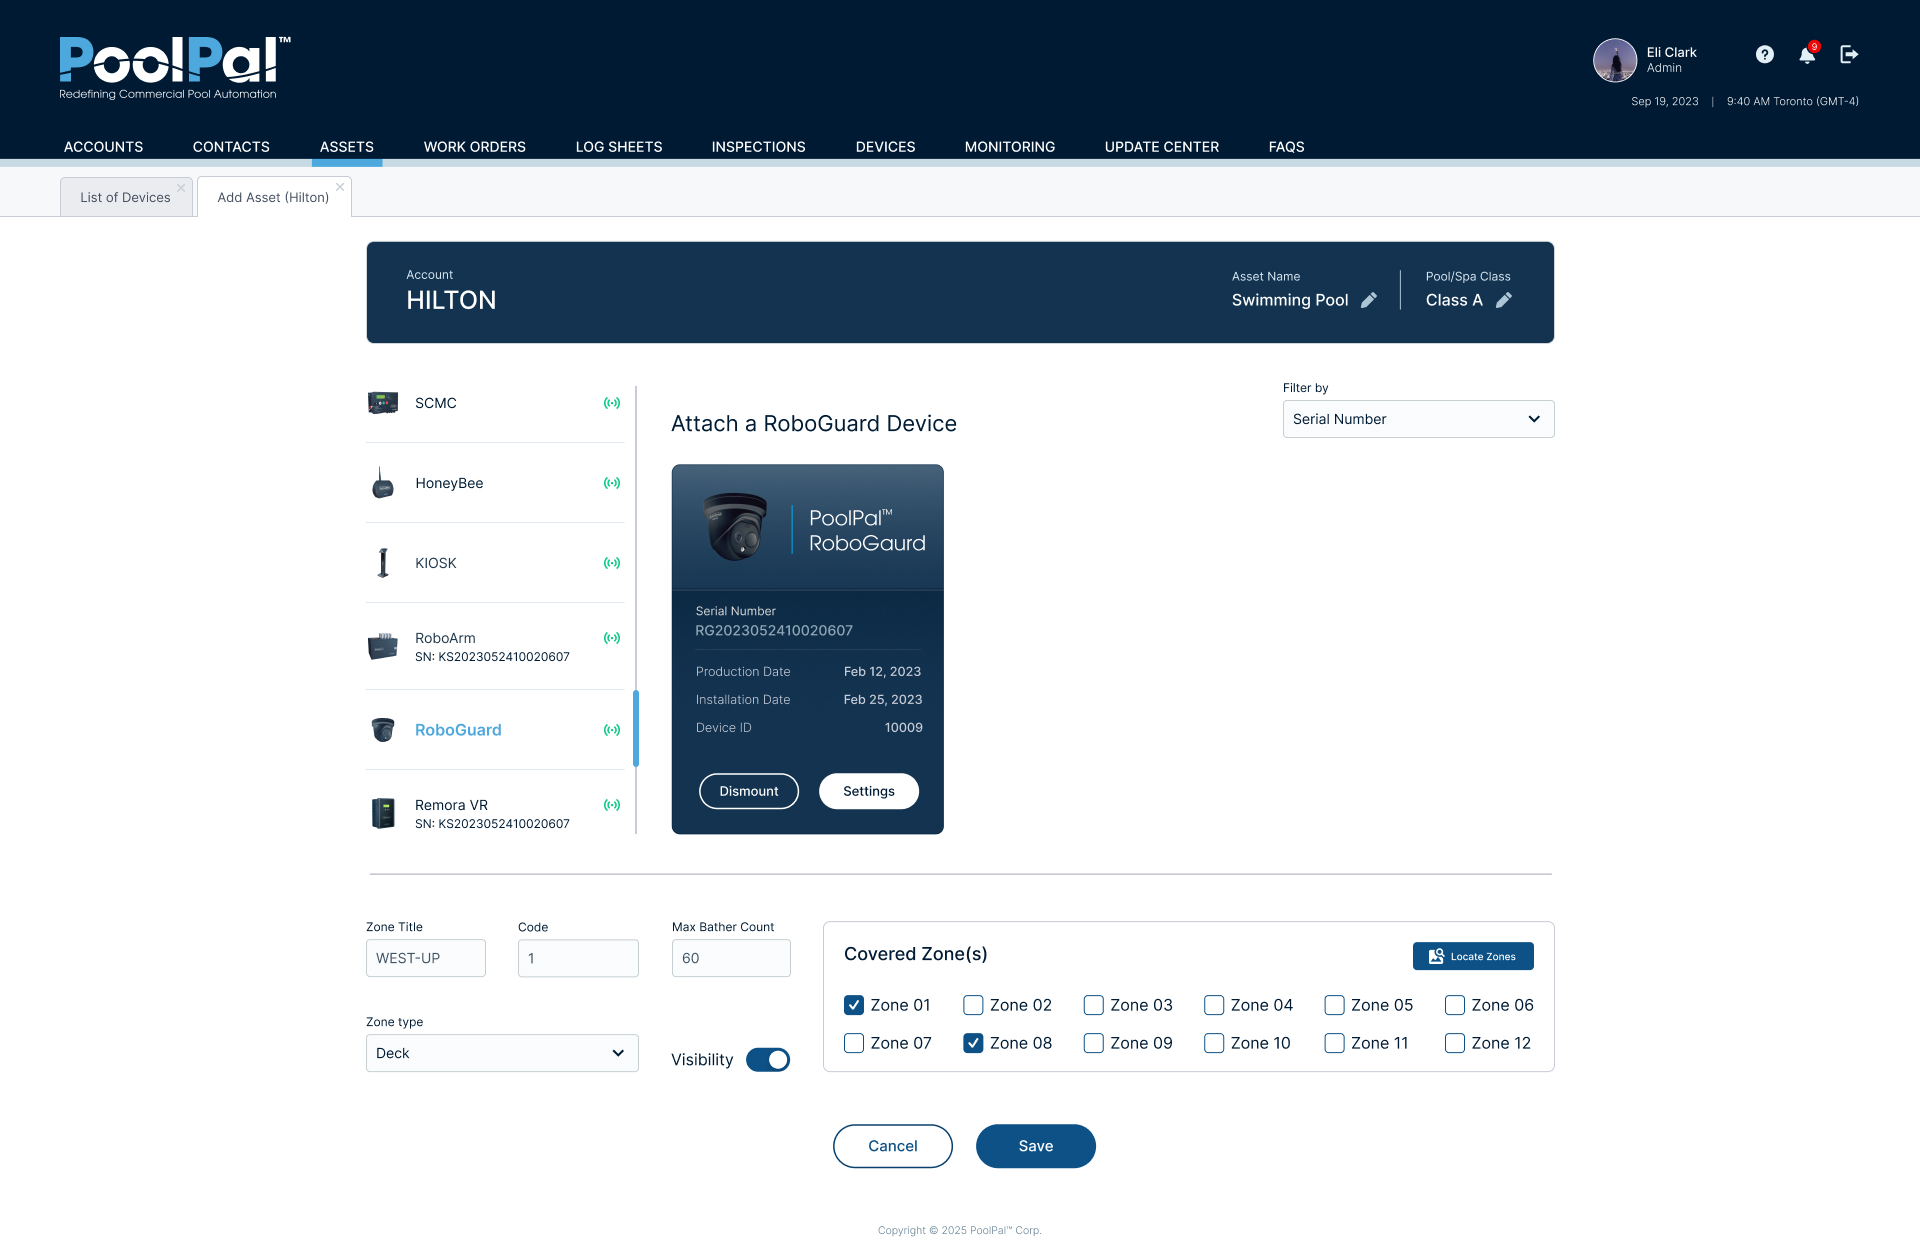
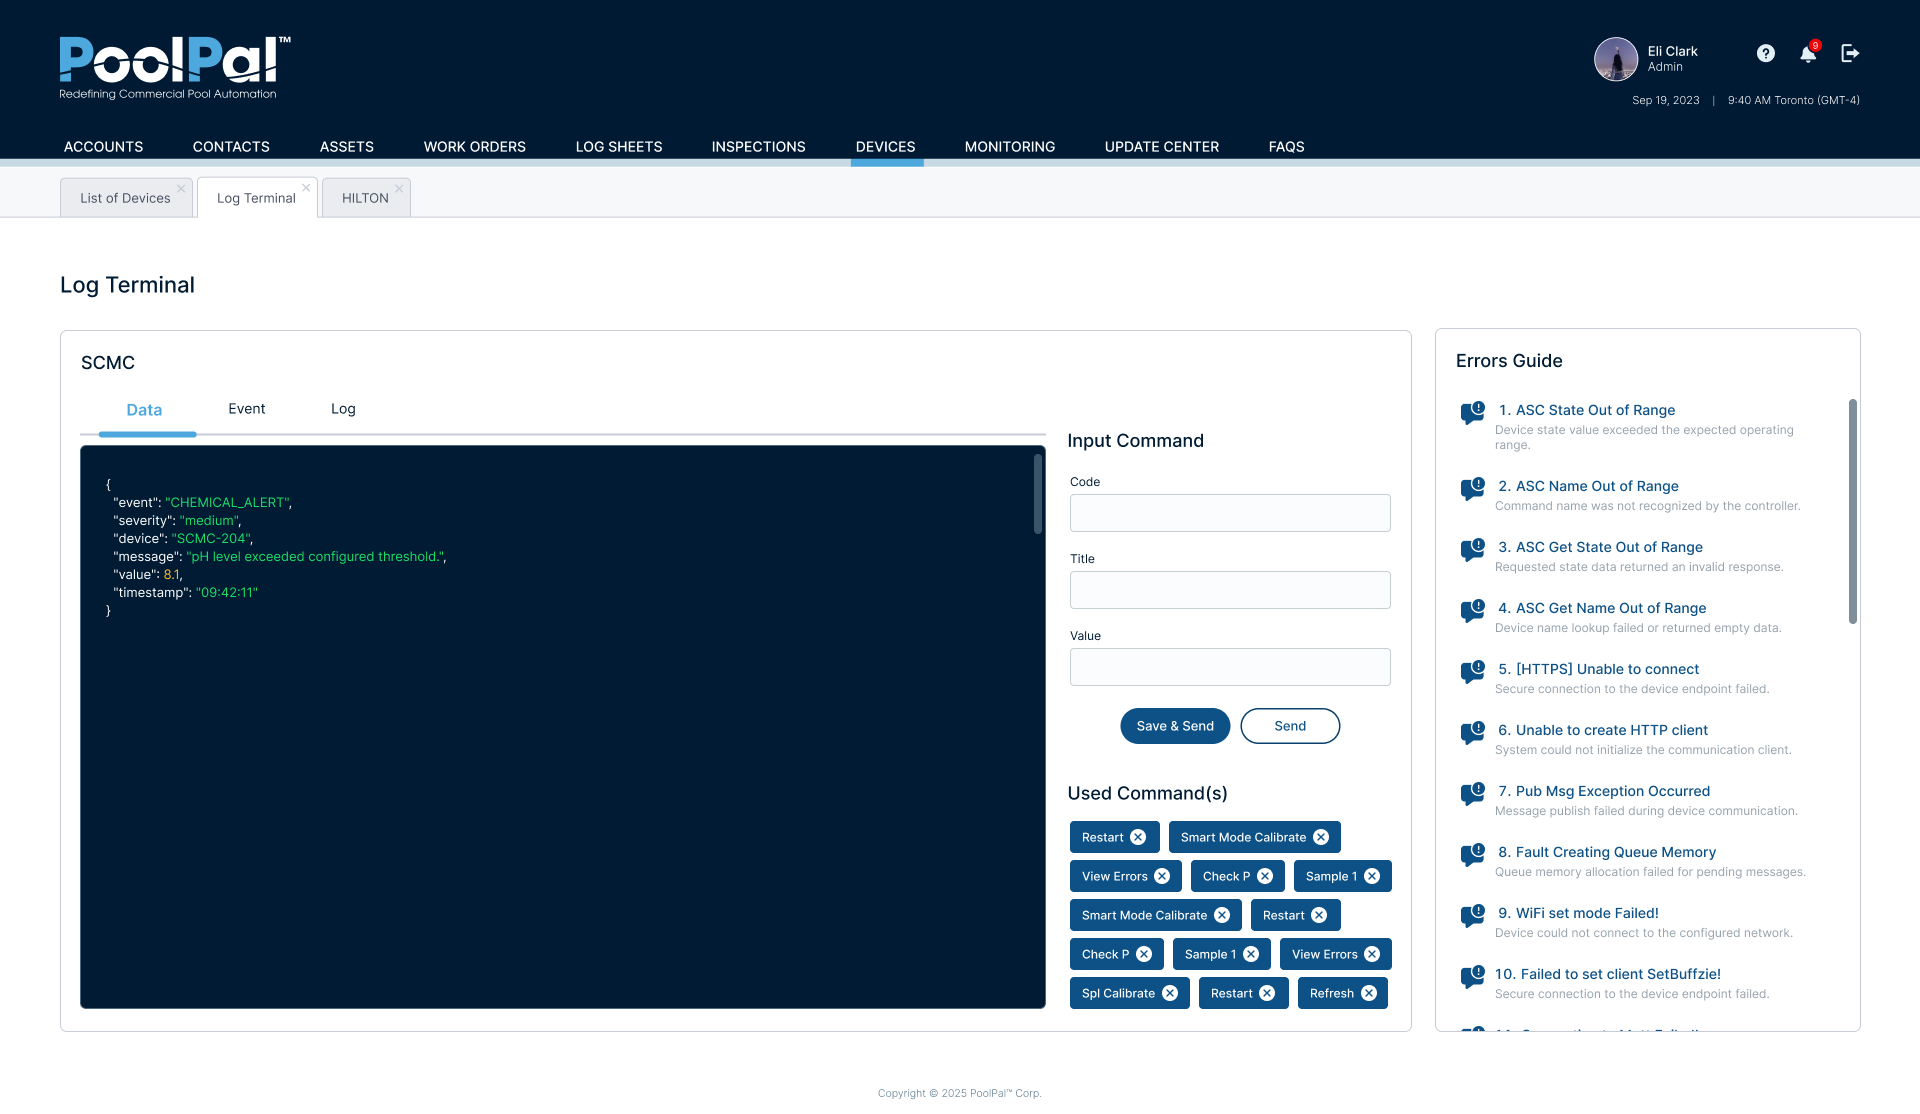
Device Settings & Configuration
In addition to real-time monitoring, I designed dedicated settings interfaces for each connected device, allowing users to configure operational rules, calibration values, thresholds, scheduling, and device-specific behaviour within the same web application.
Because each product had different technical requirements, the settings varied by device, but I kept the overall structure consistent so users could move between products without relearning the interface.
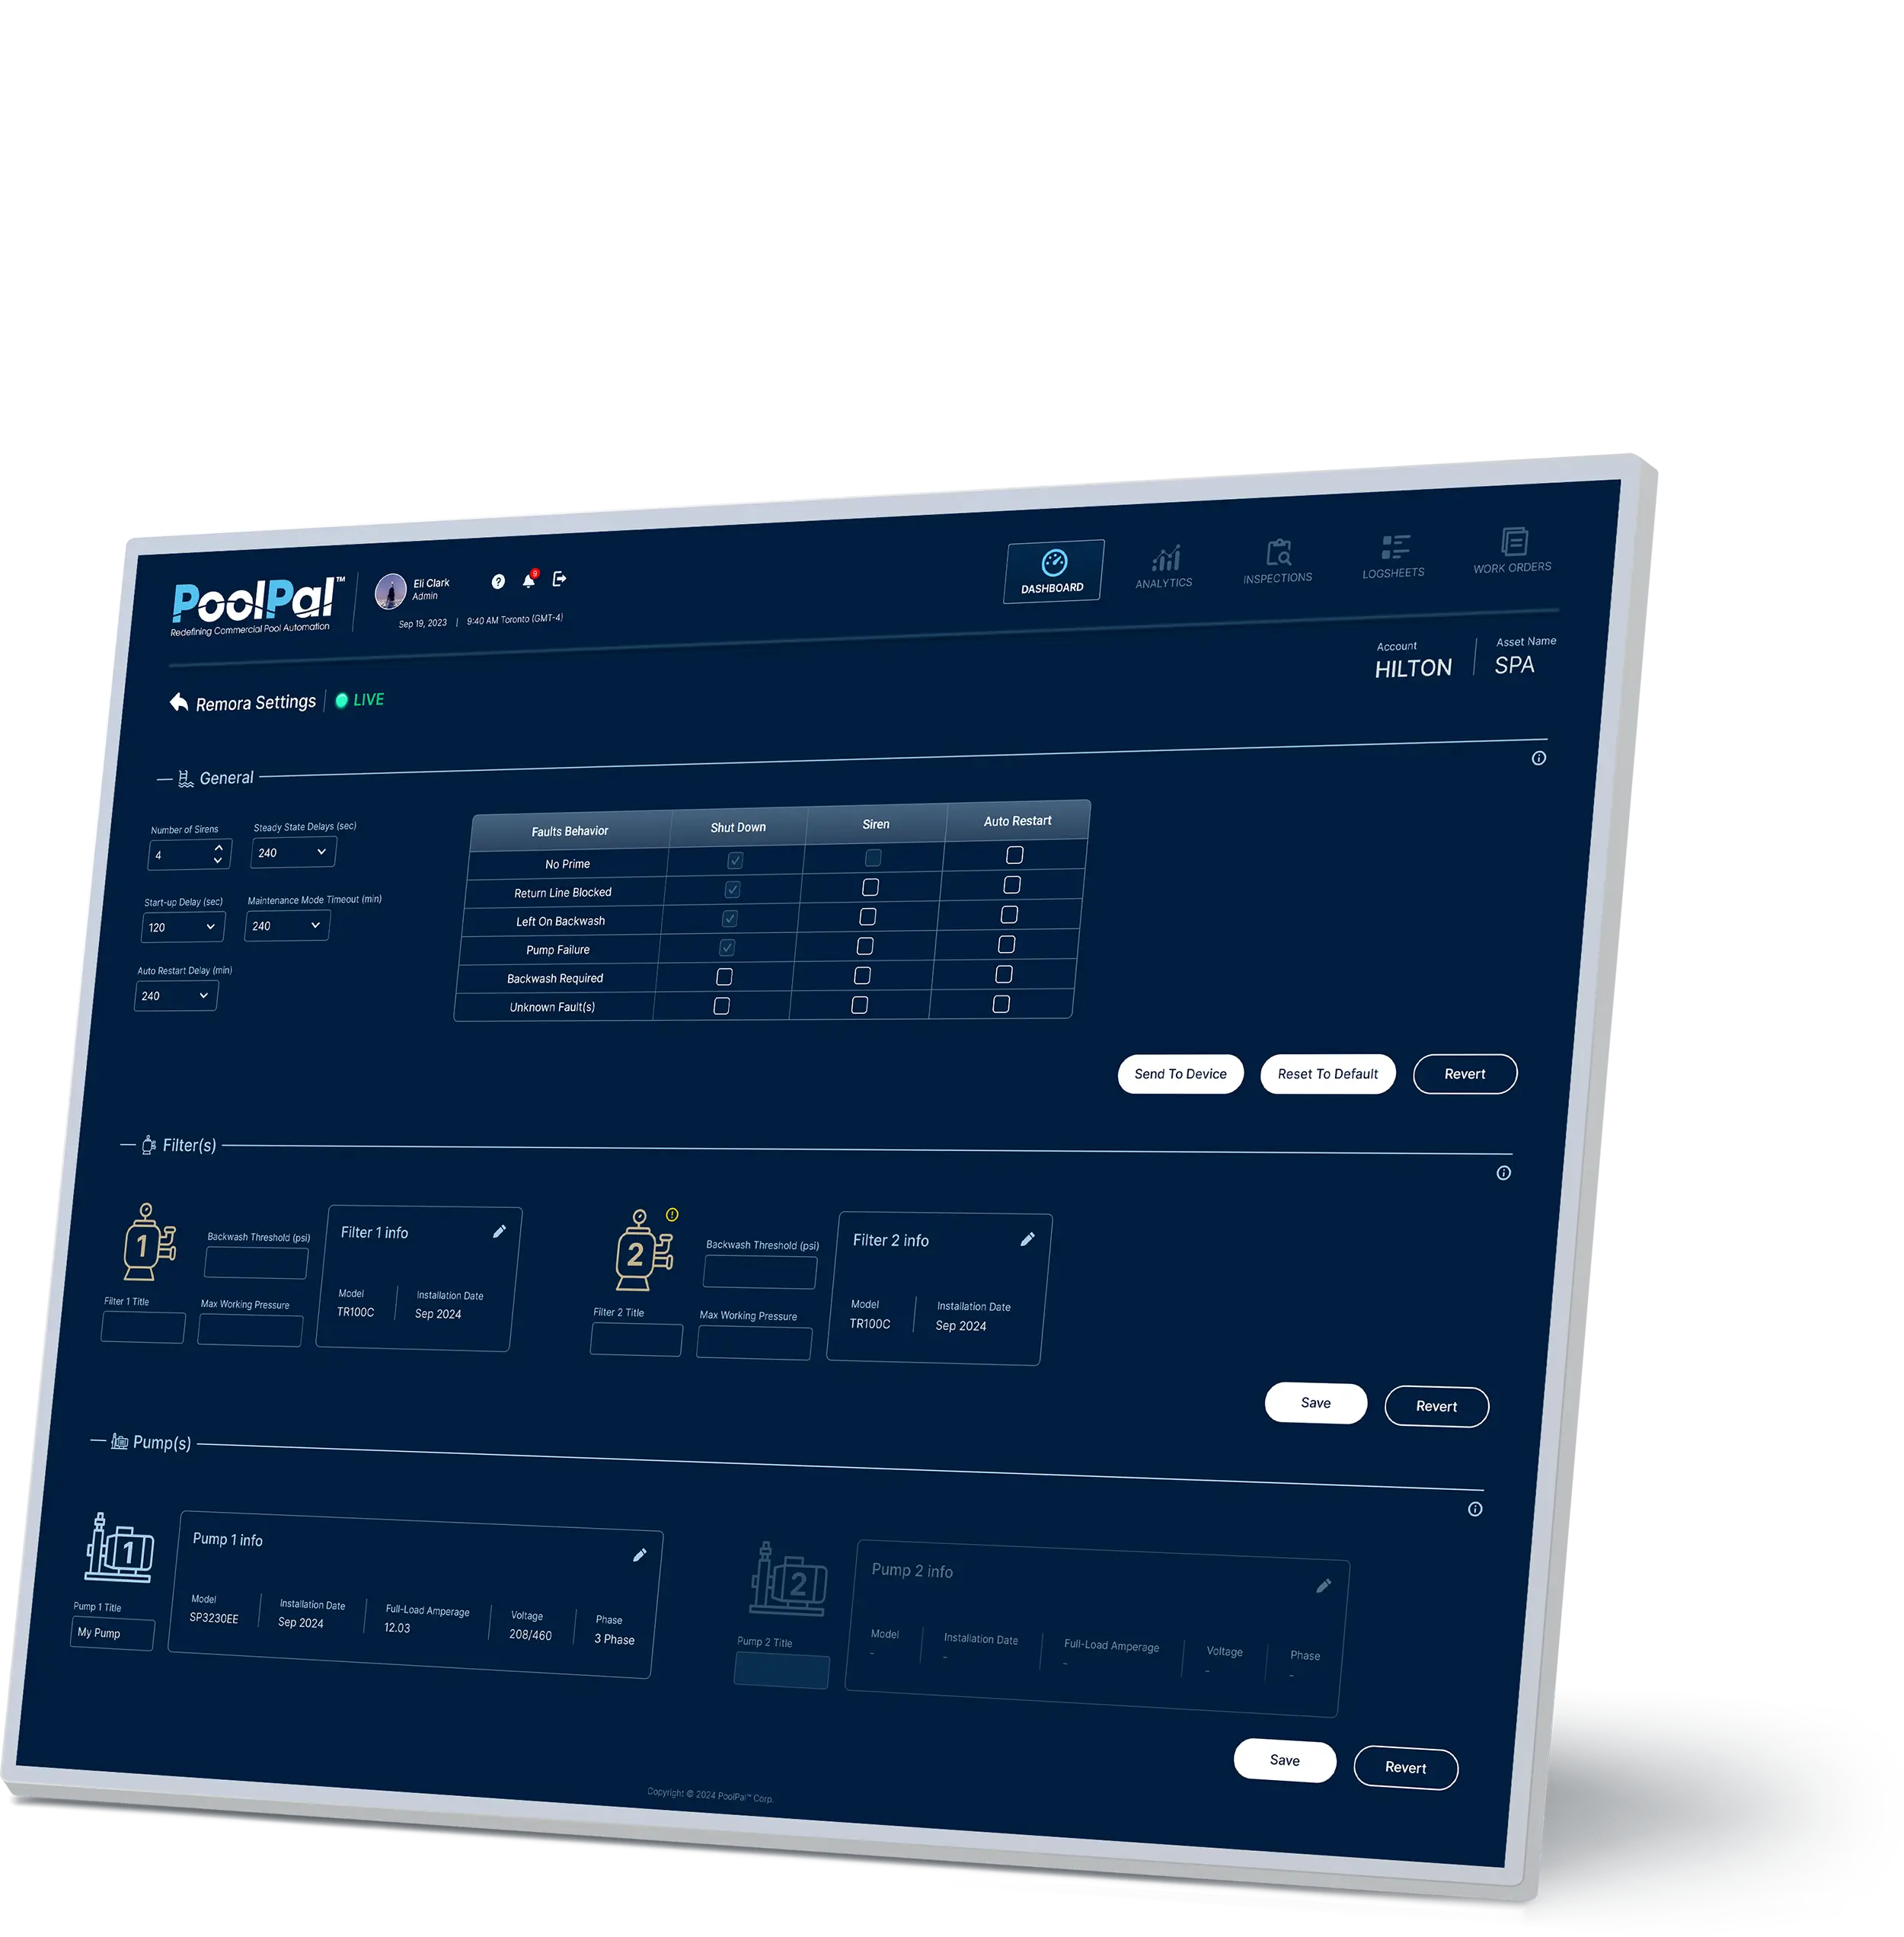
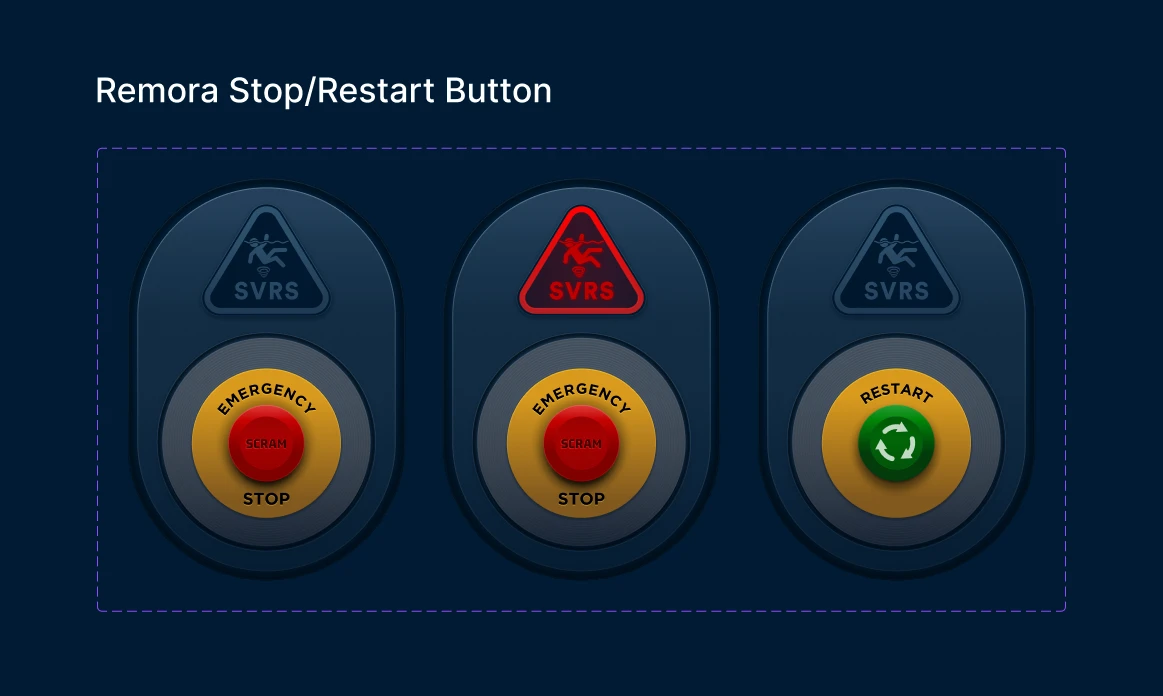
Remora Settings
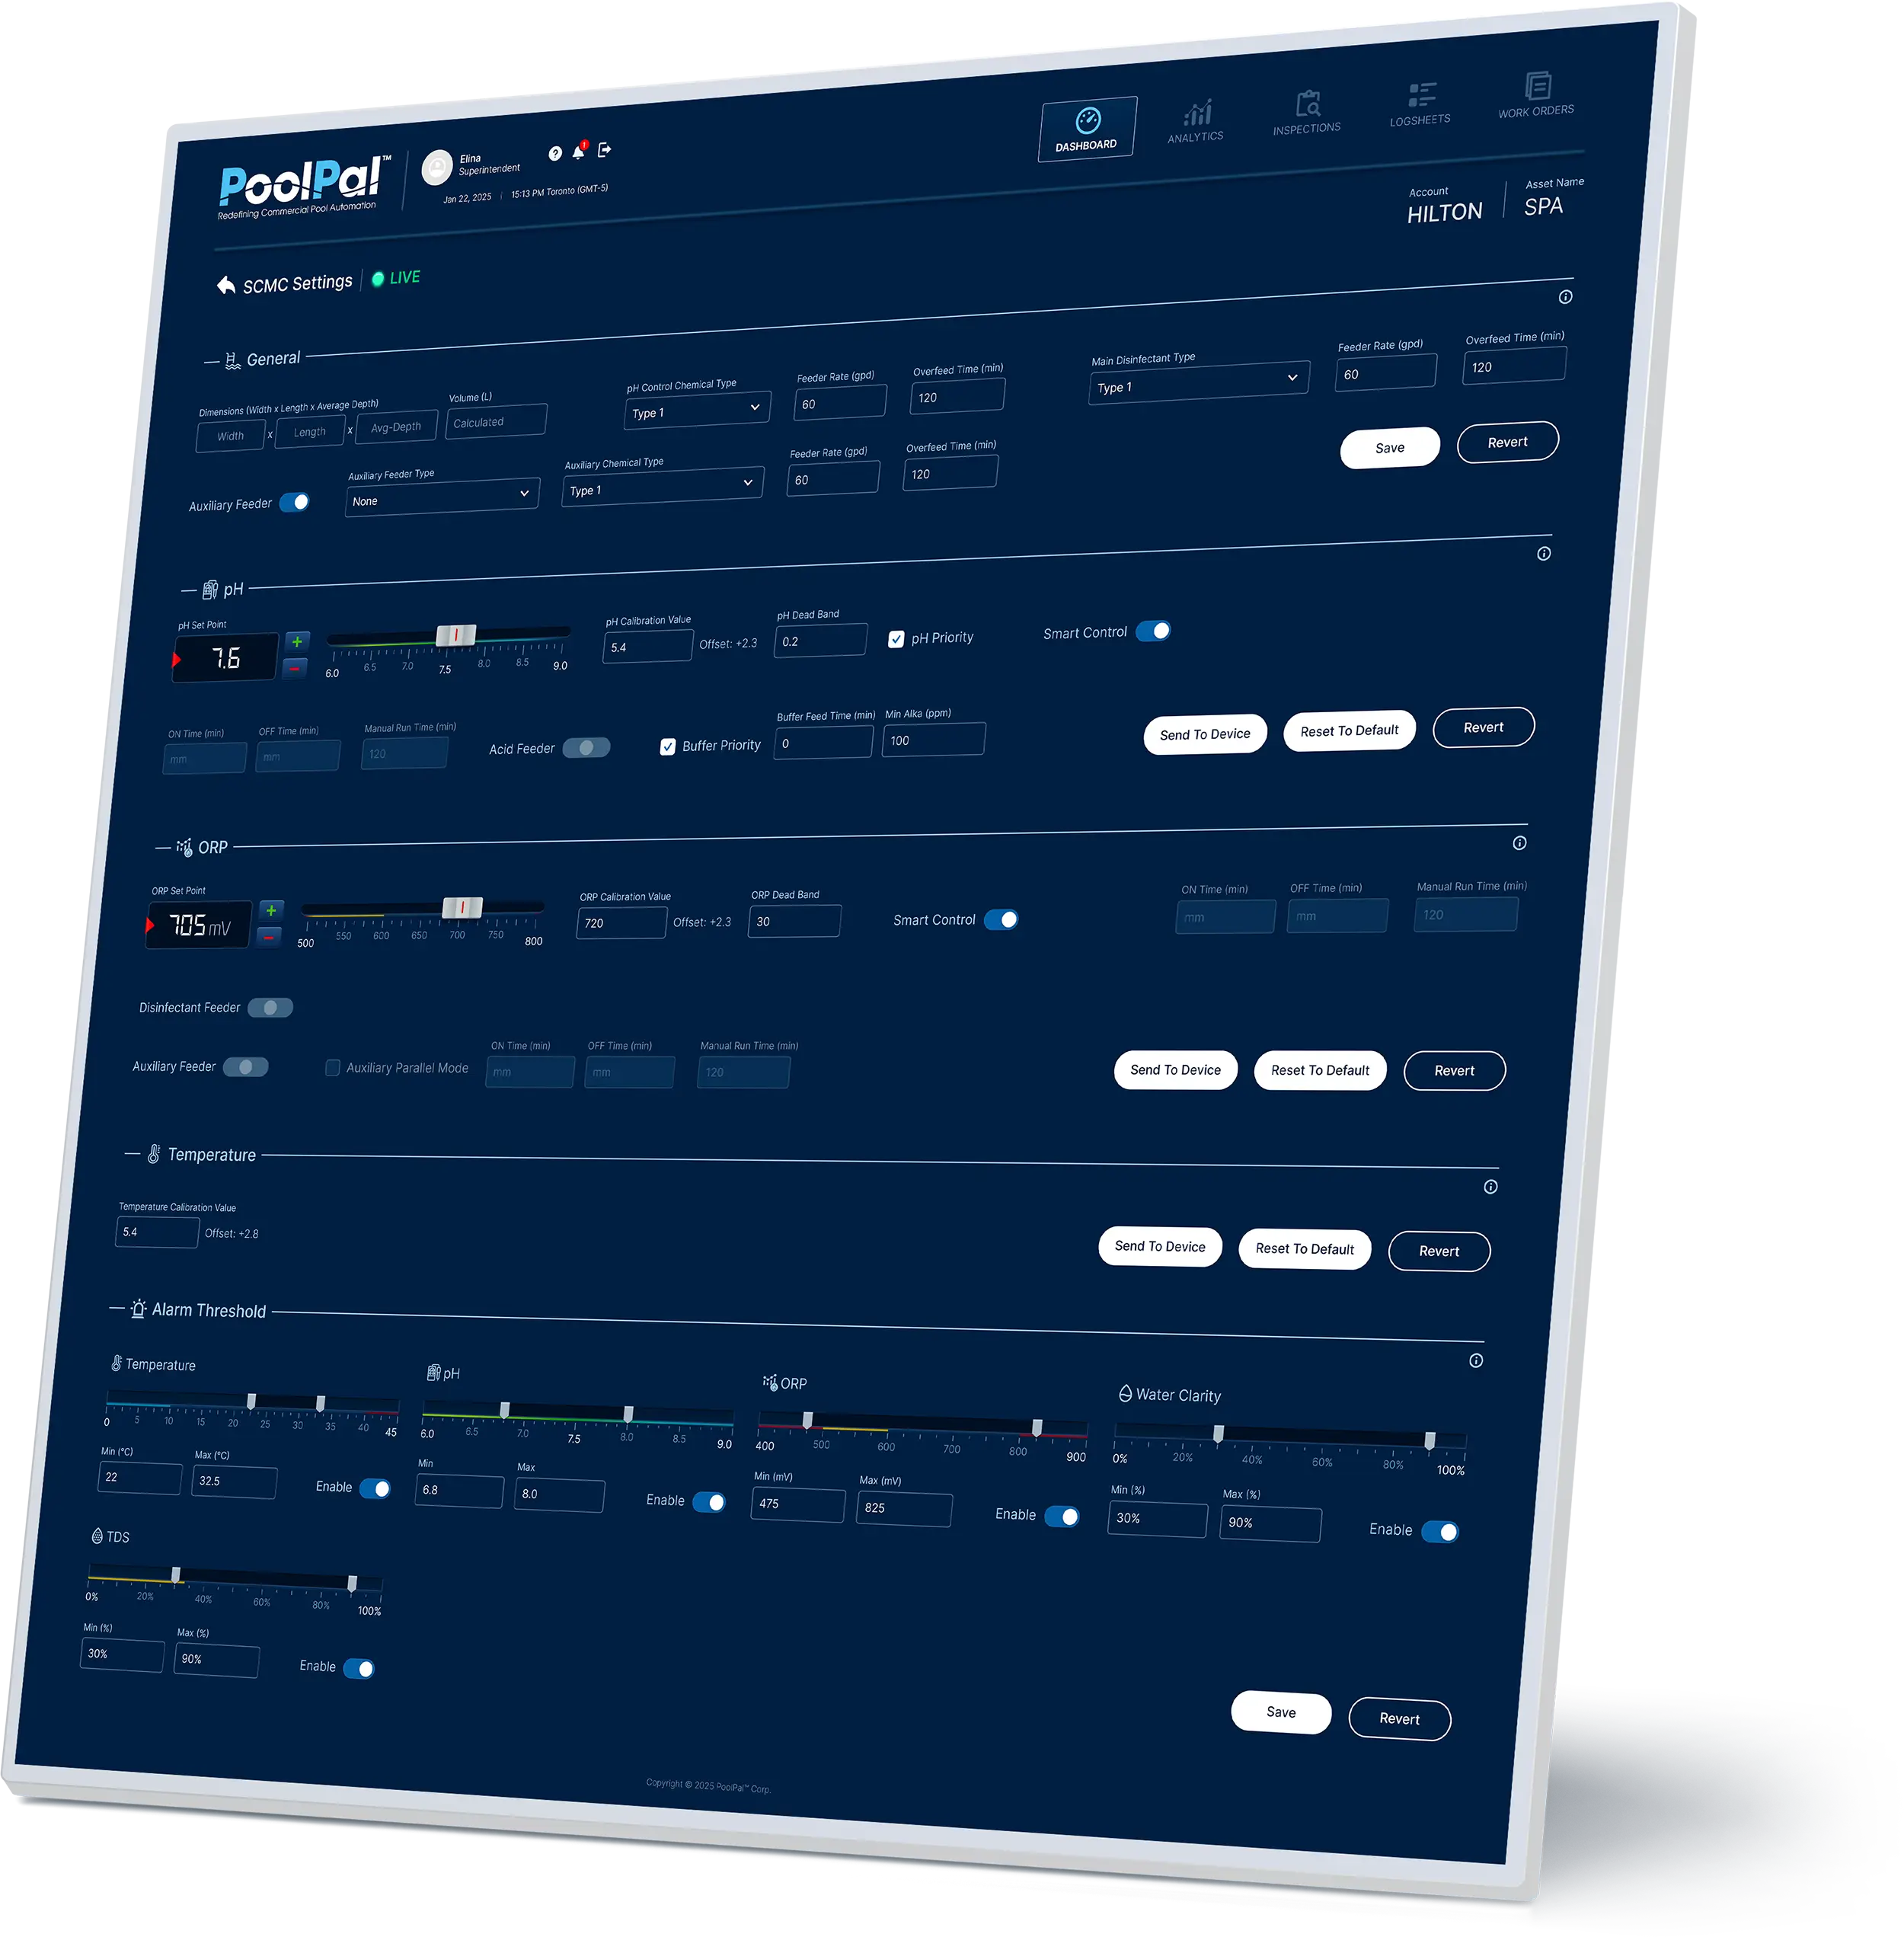
SCMC Settings
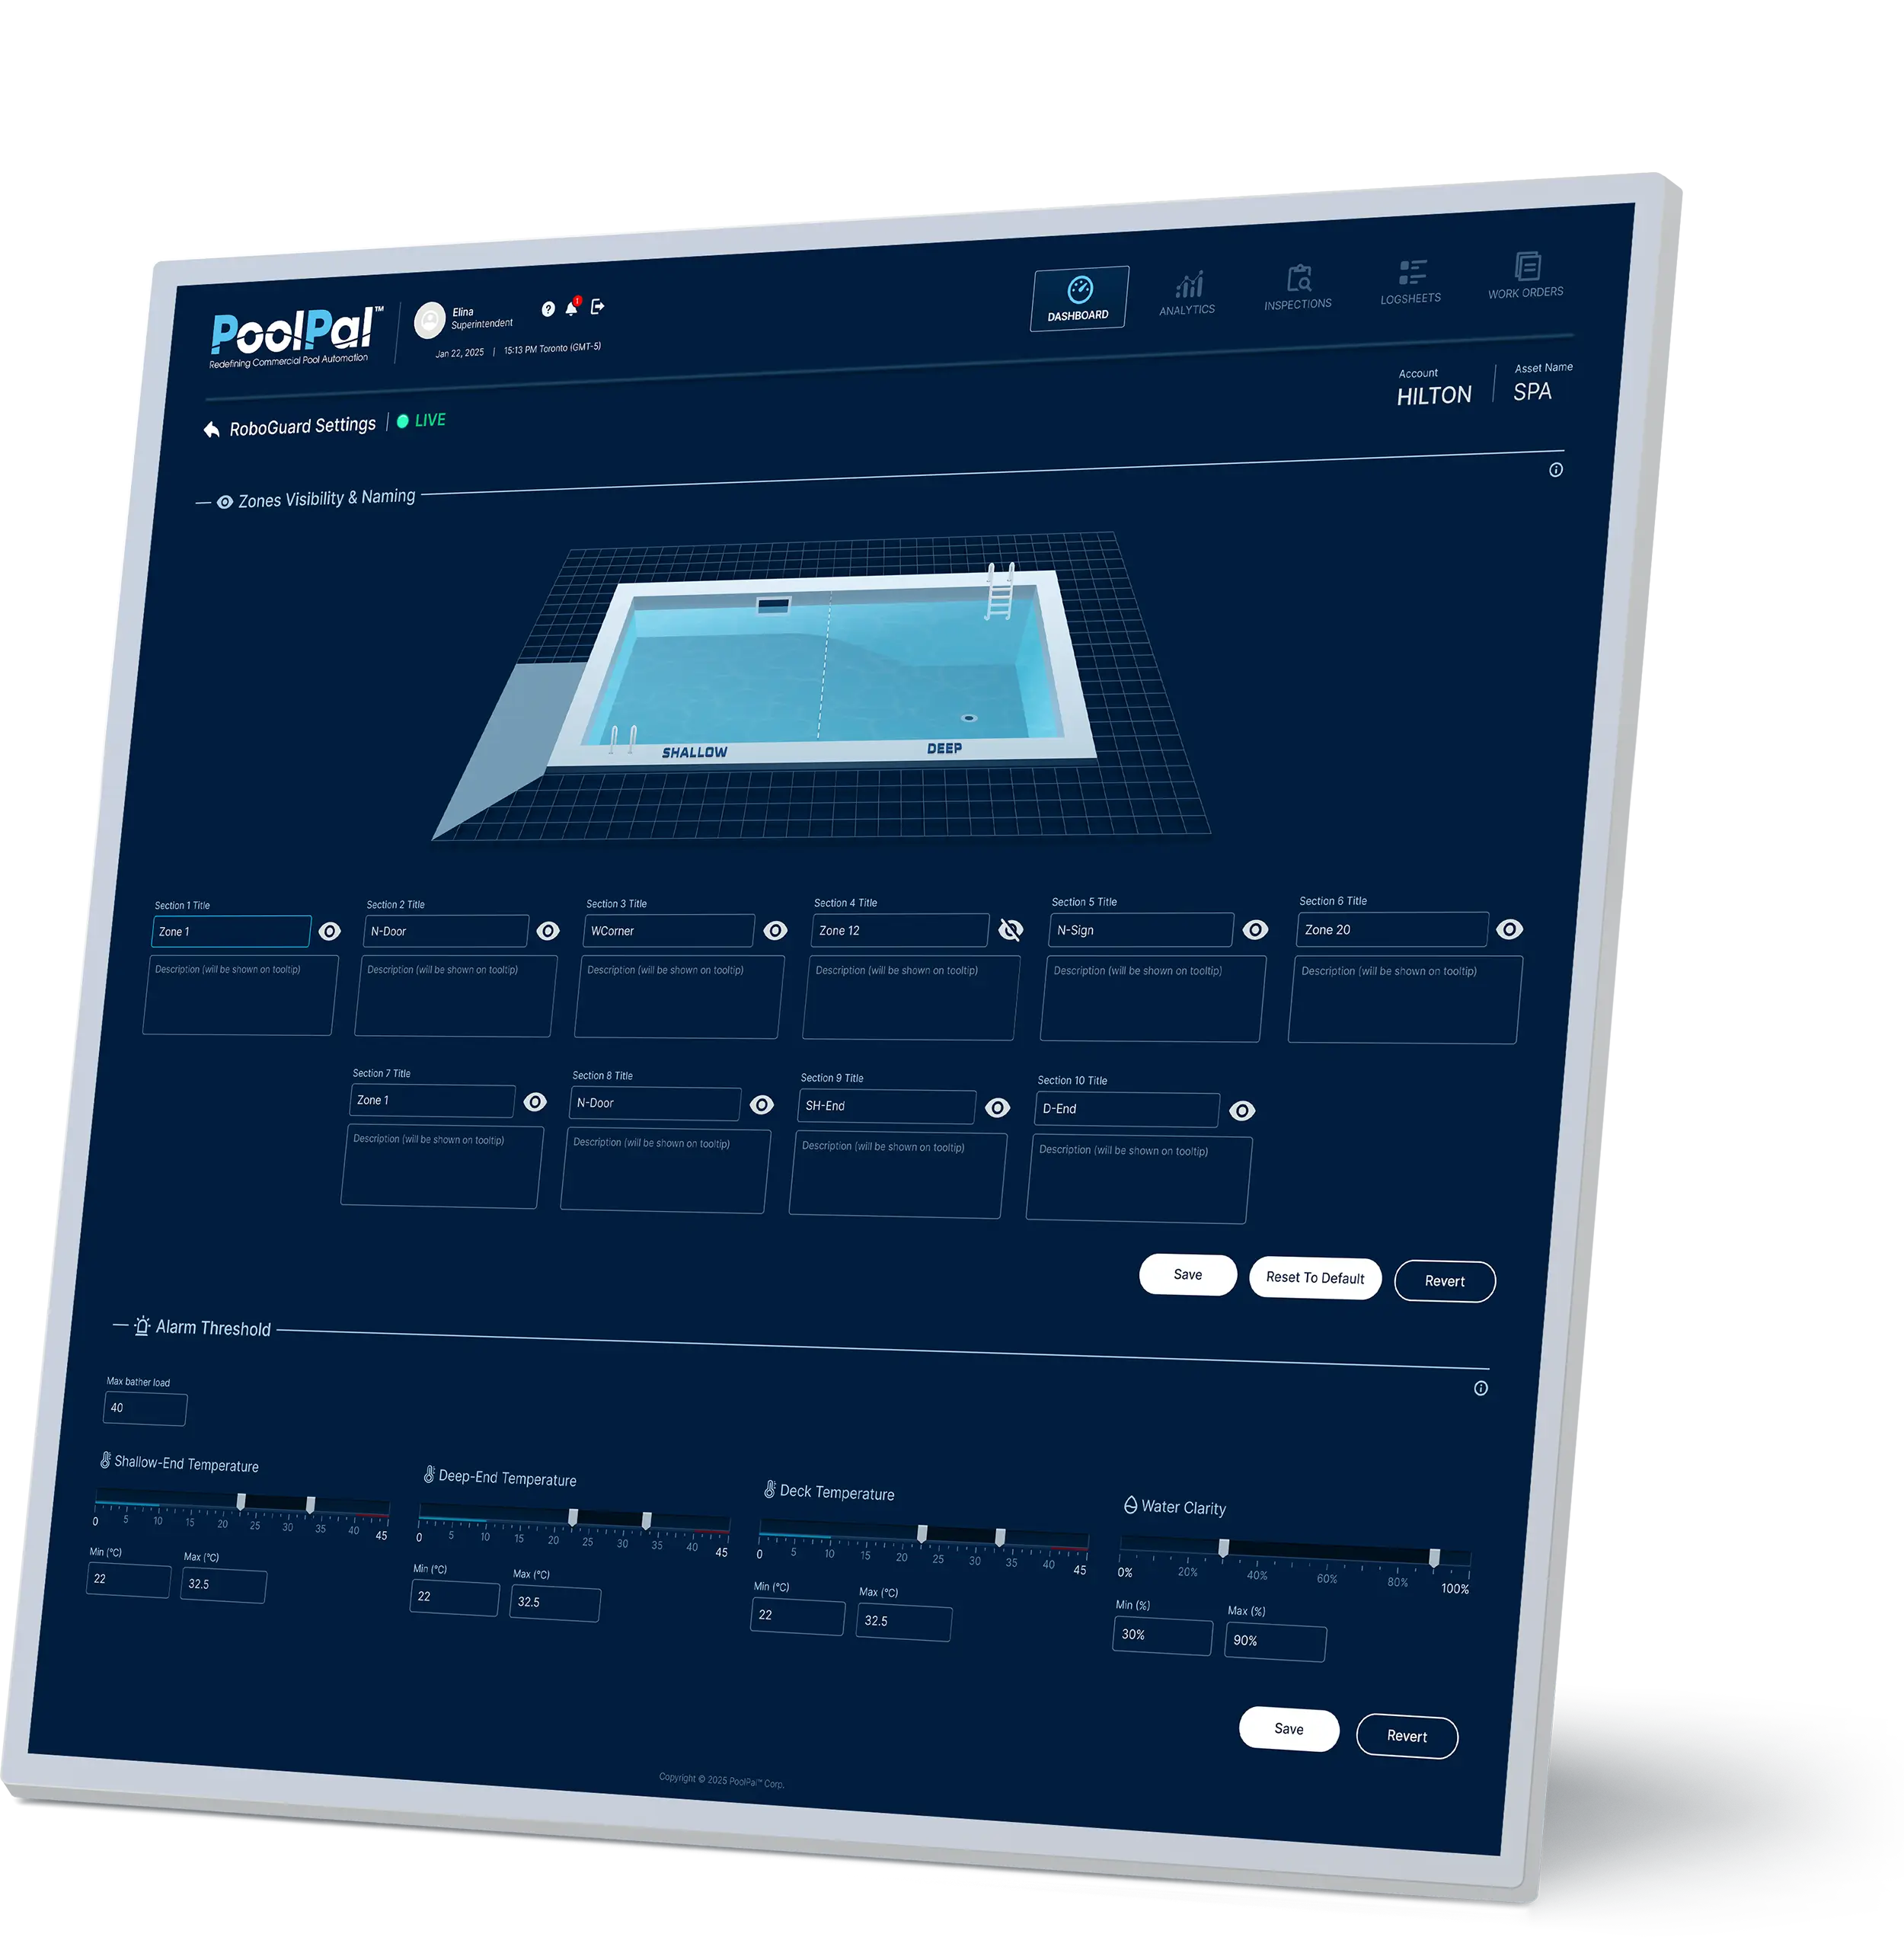
RoboGuard Settings
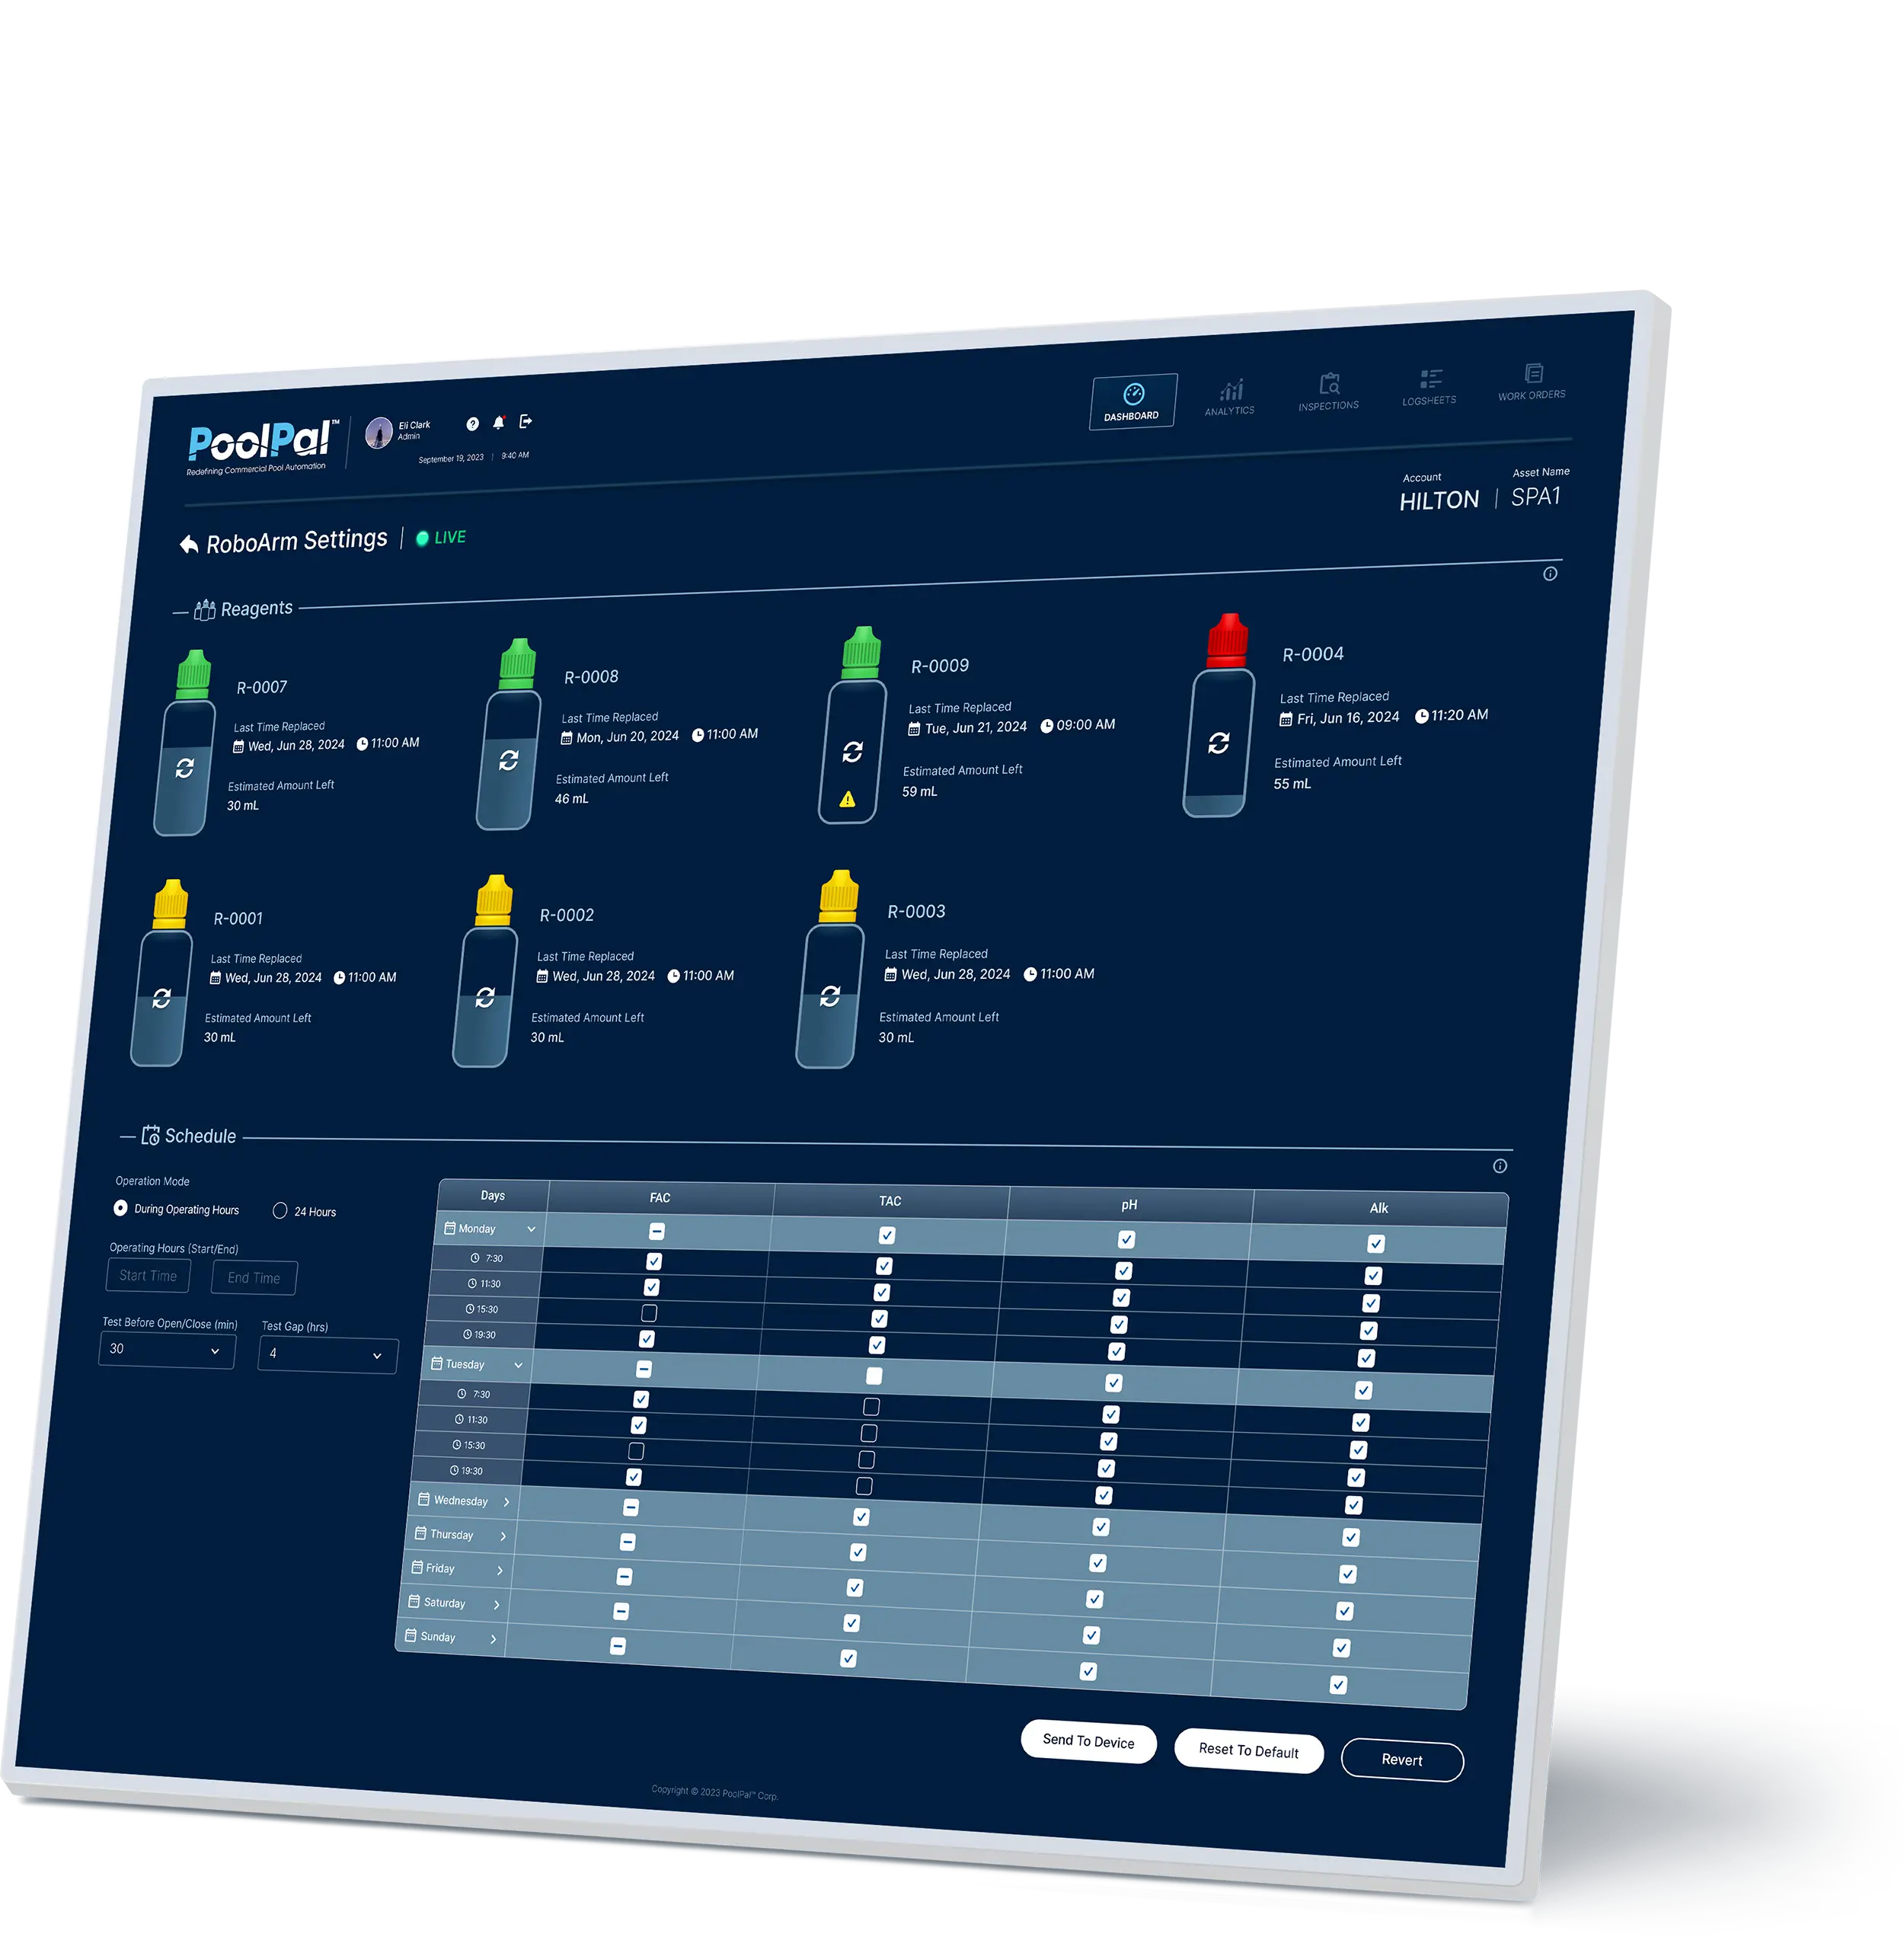
RoboArm Settings
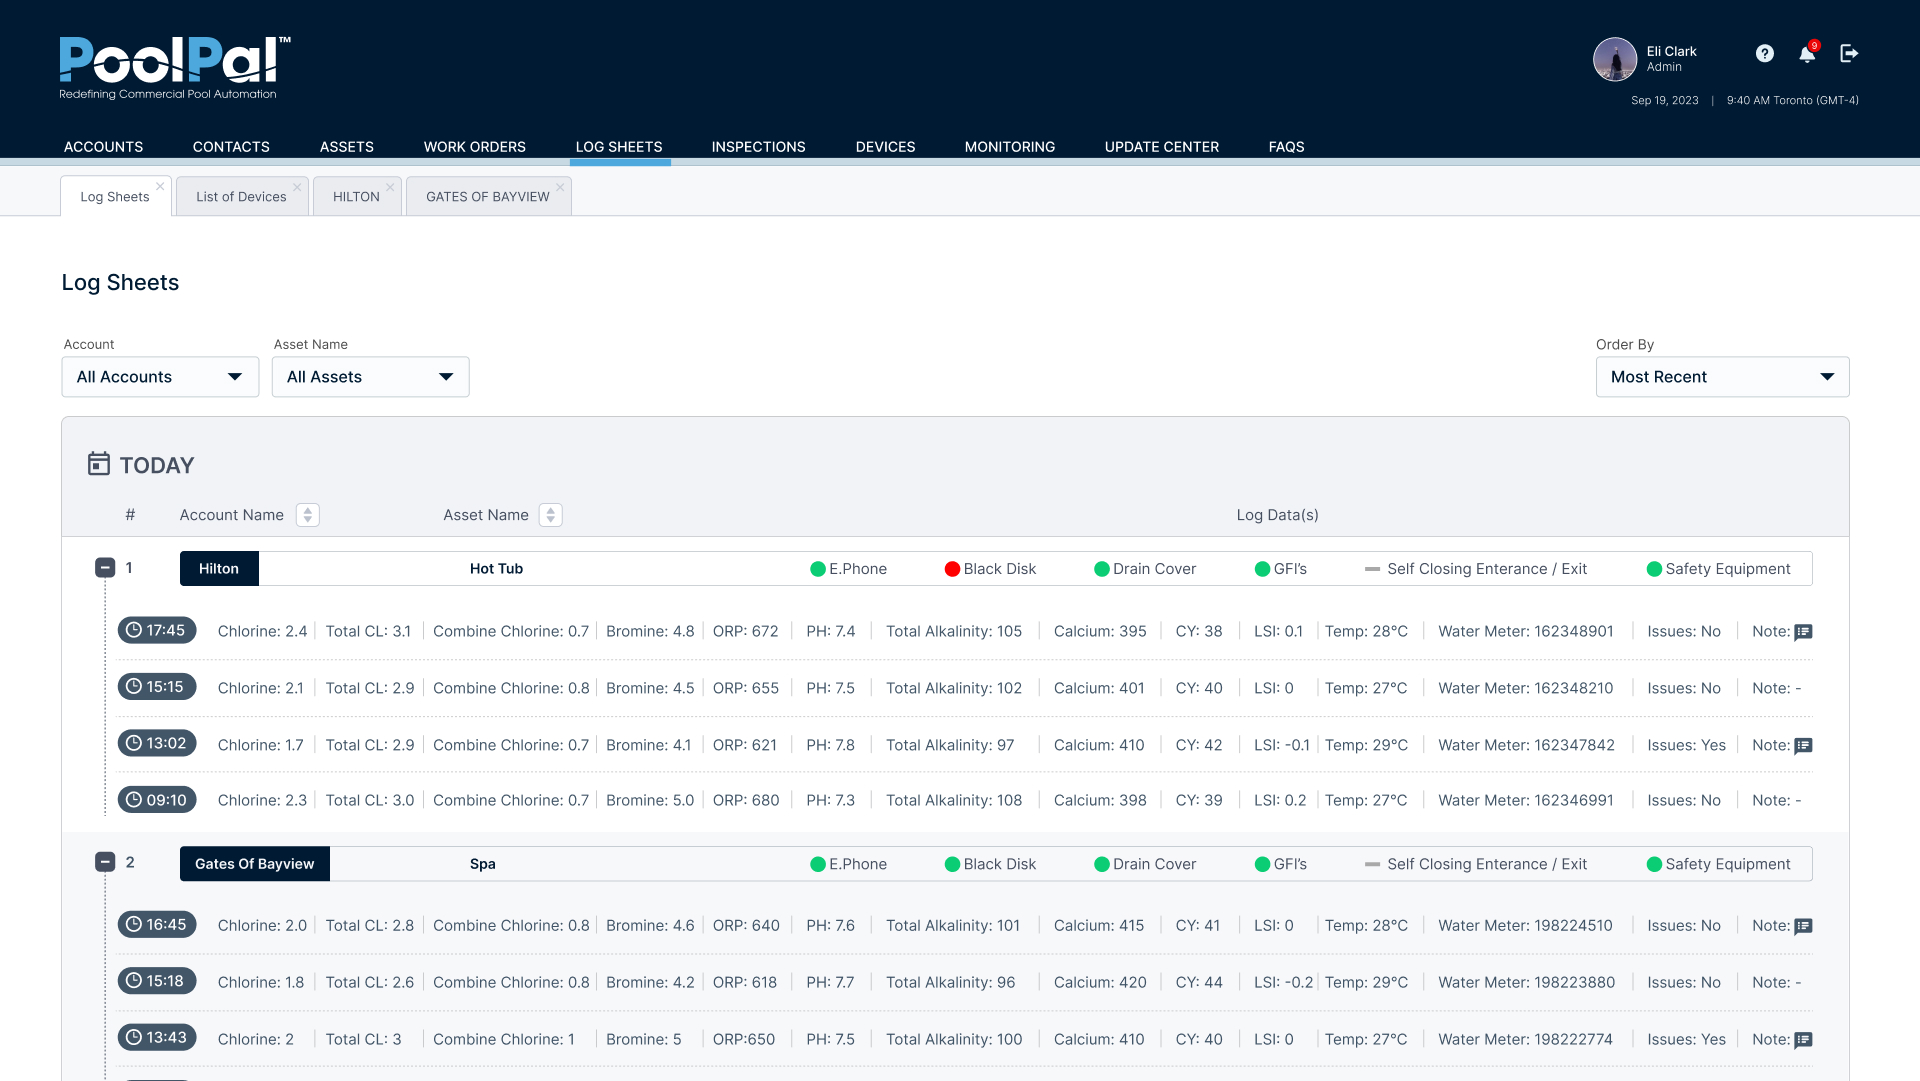
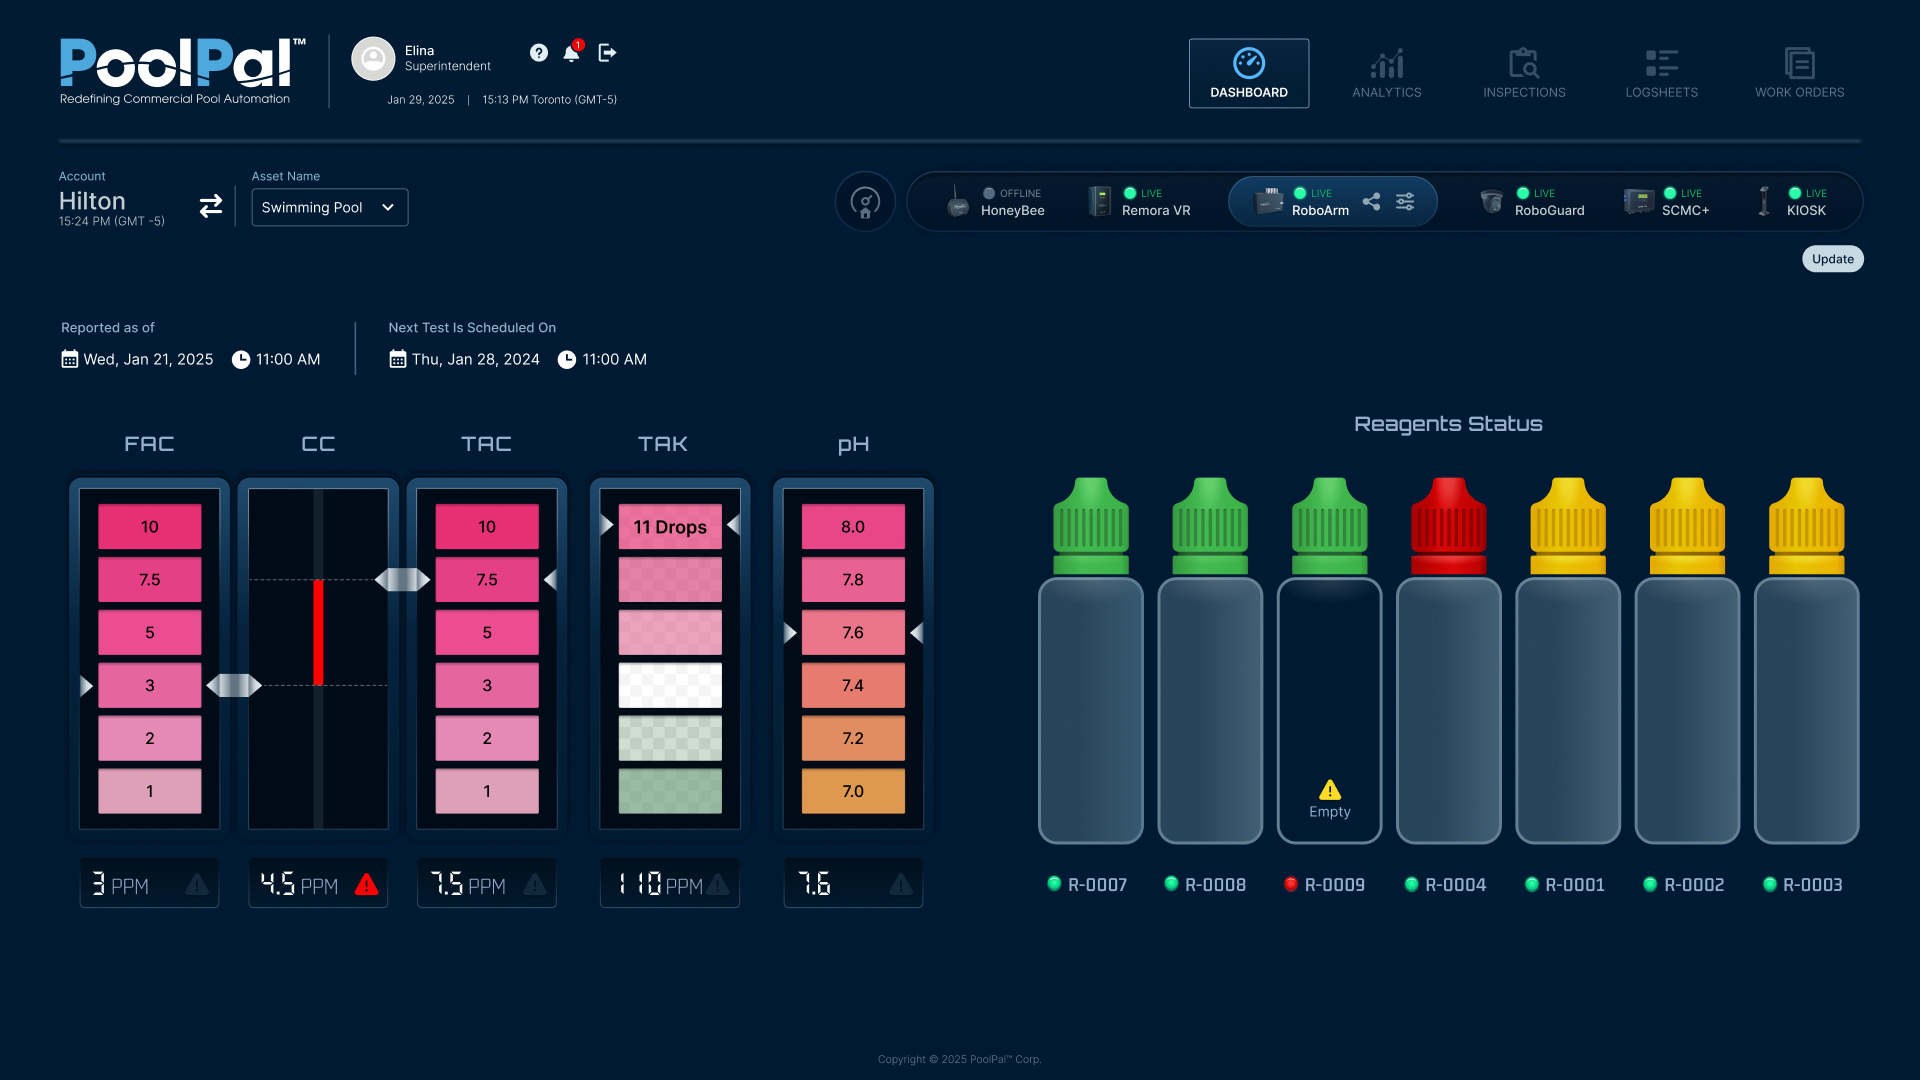
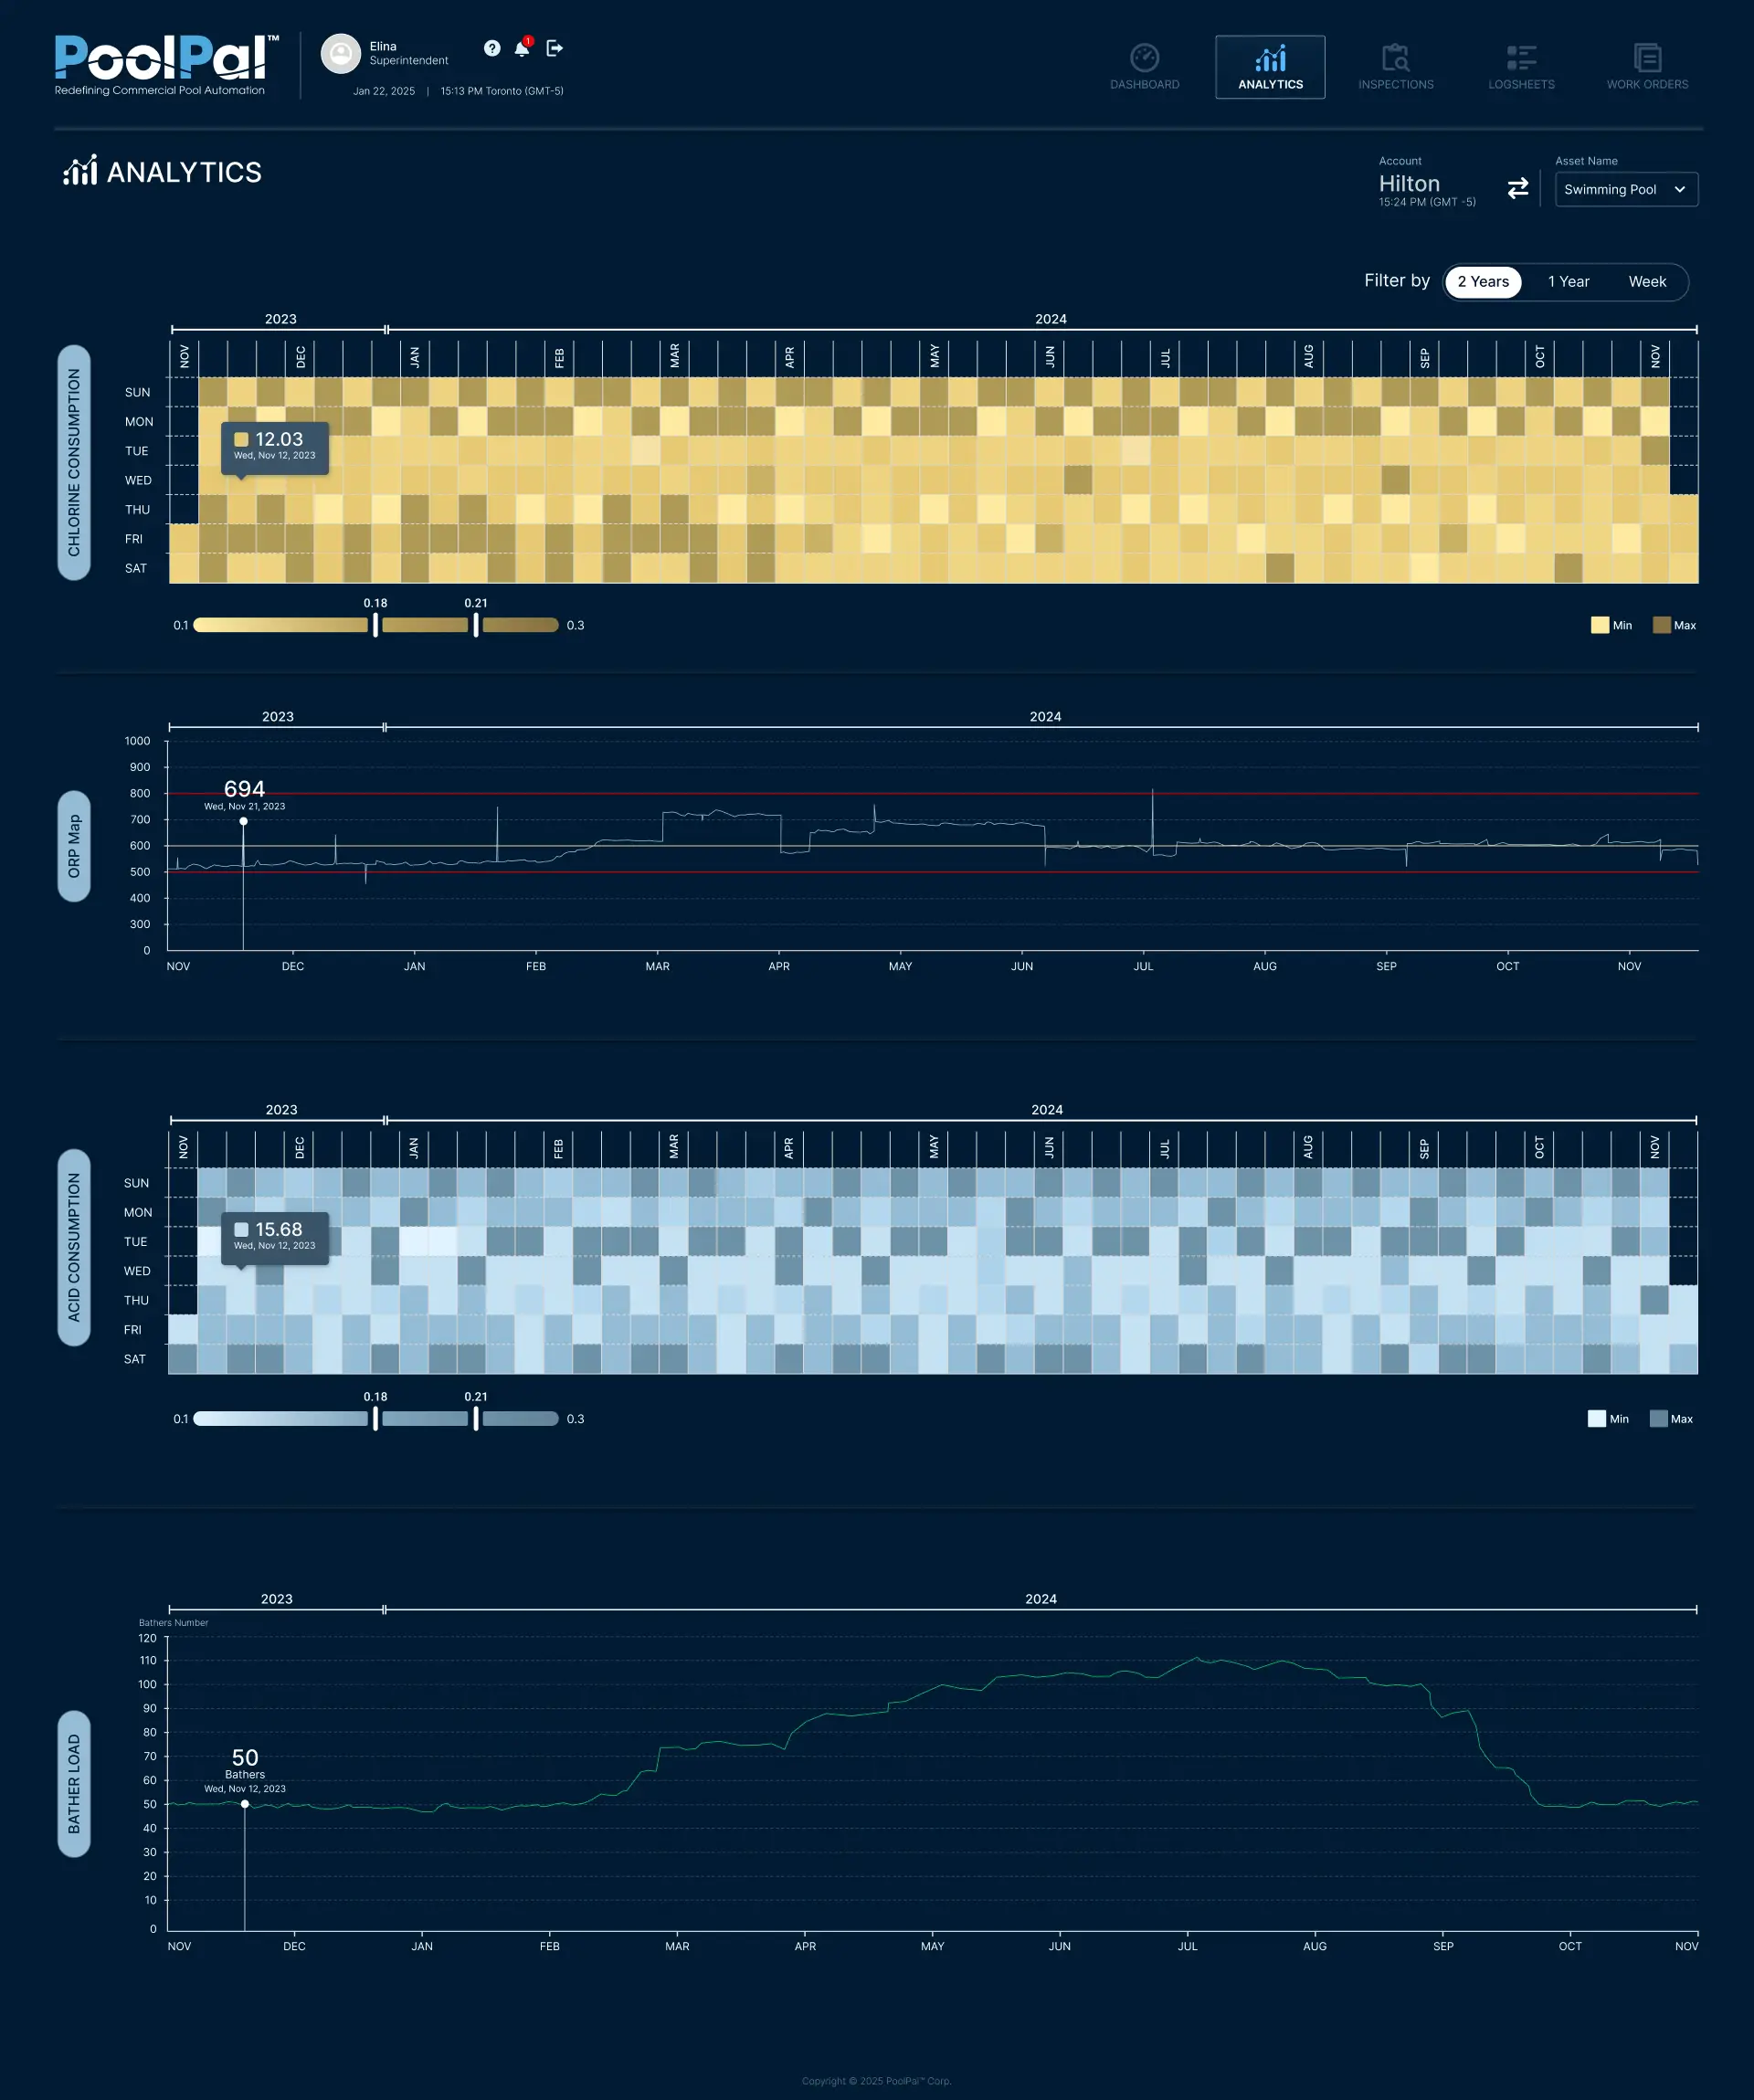
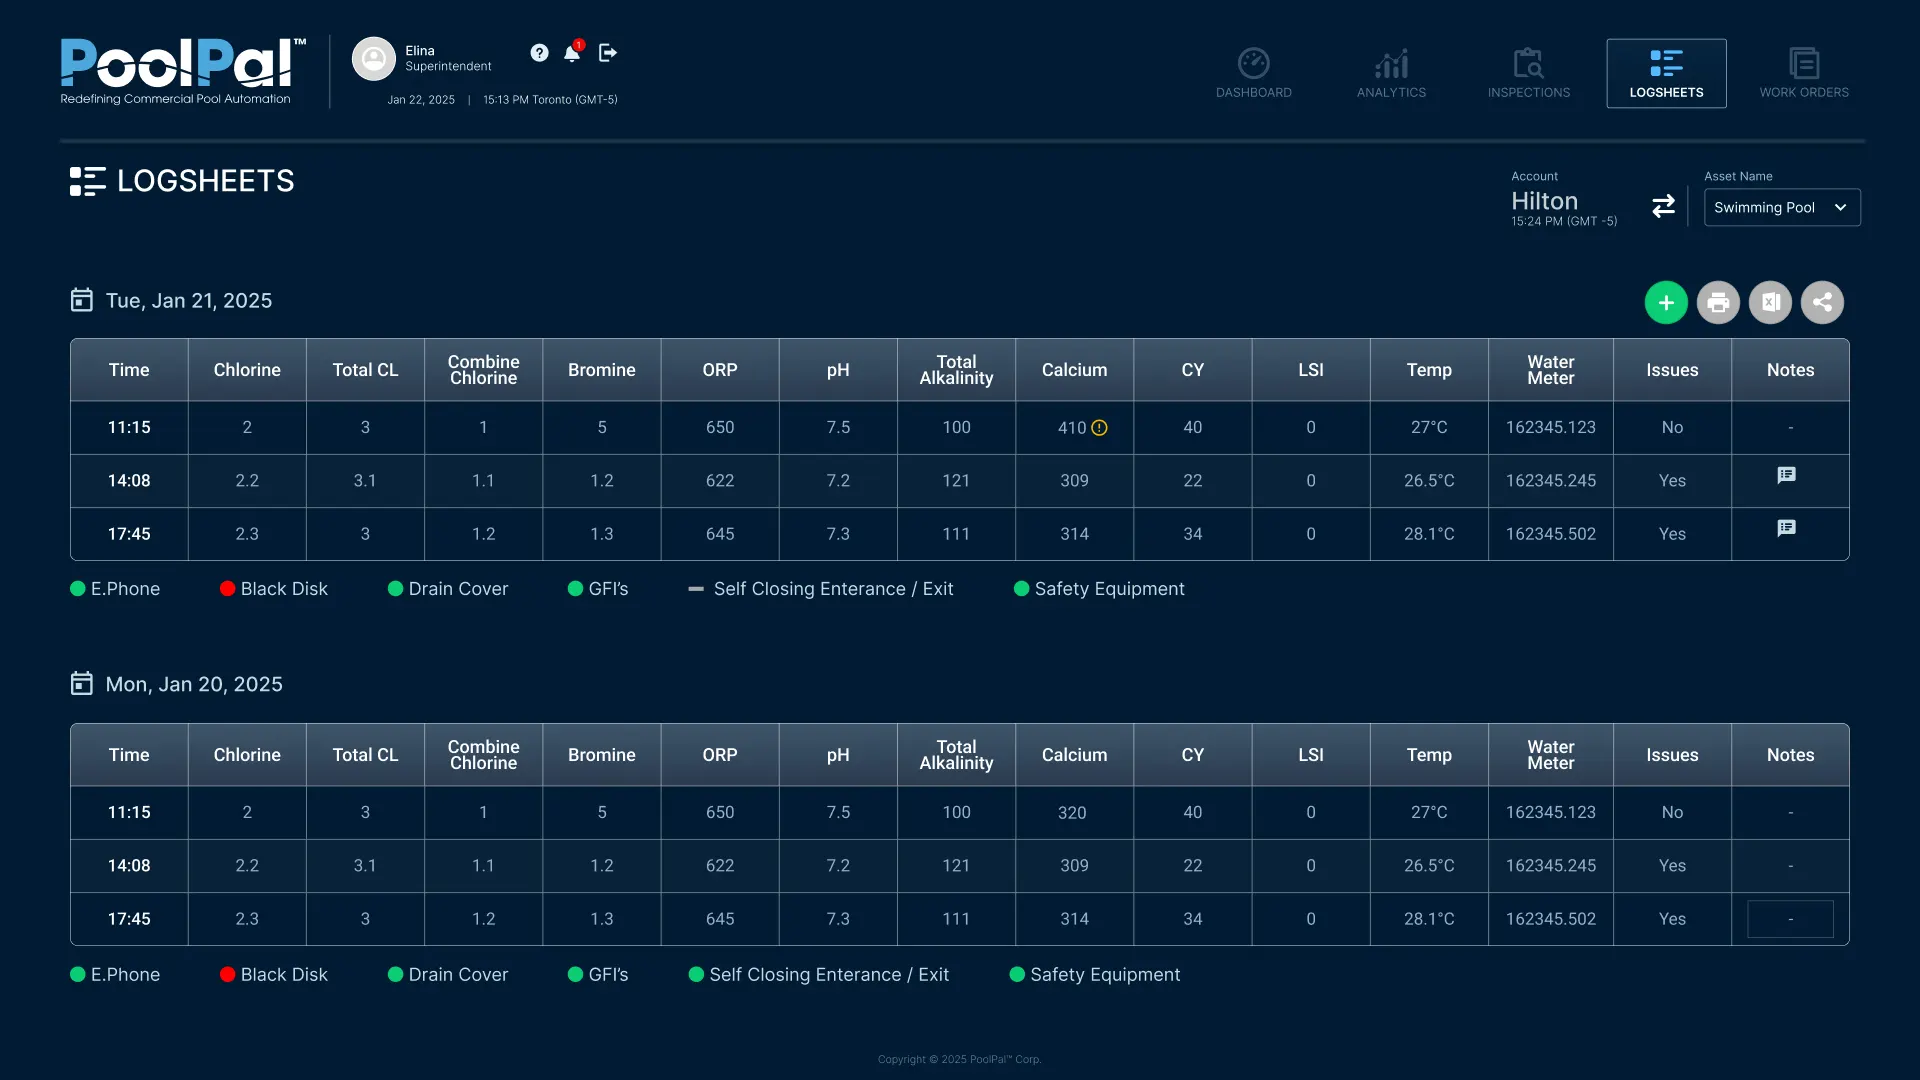
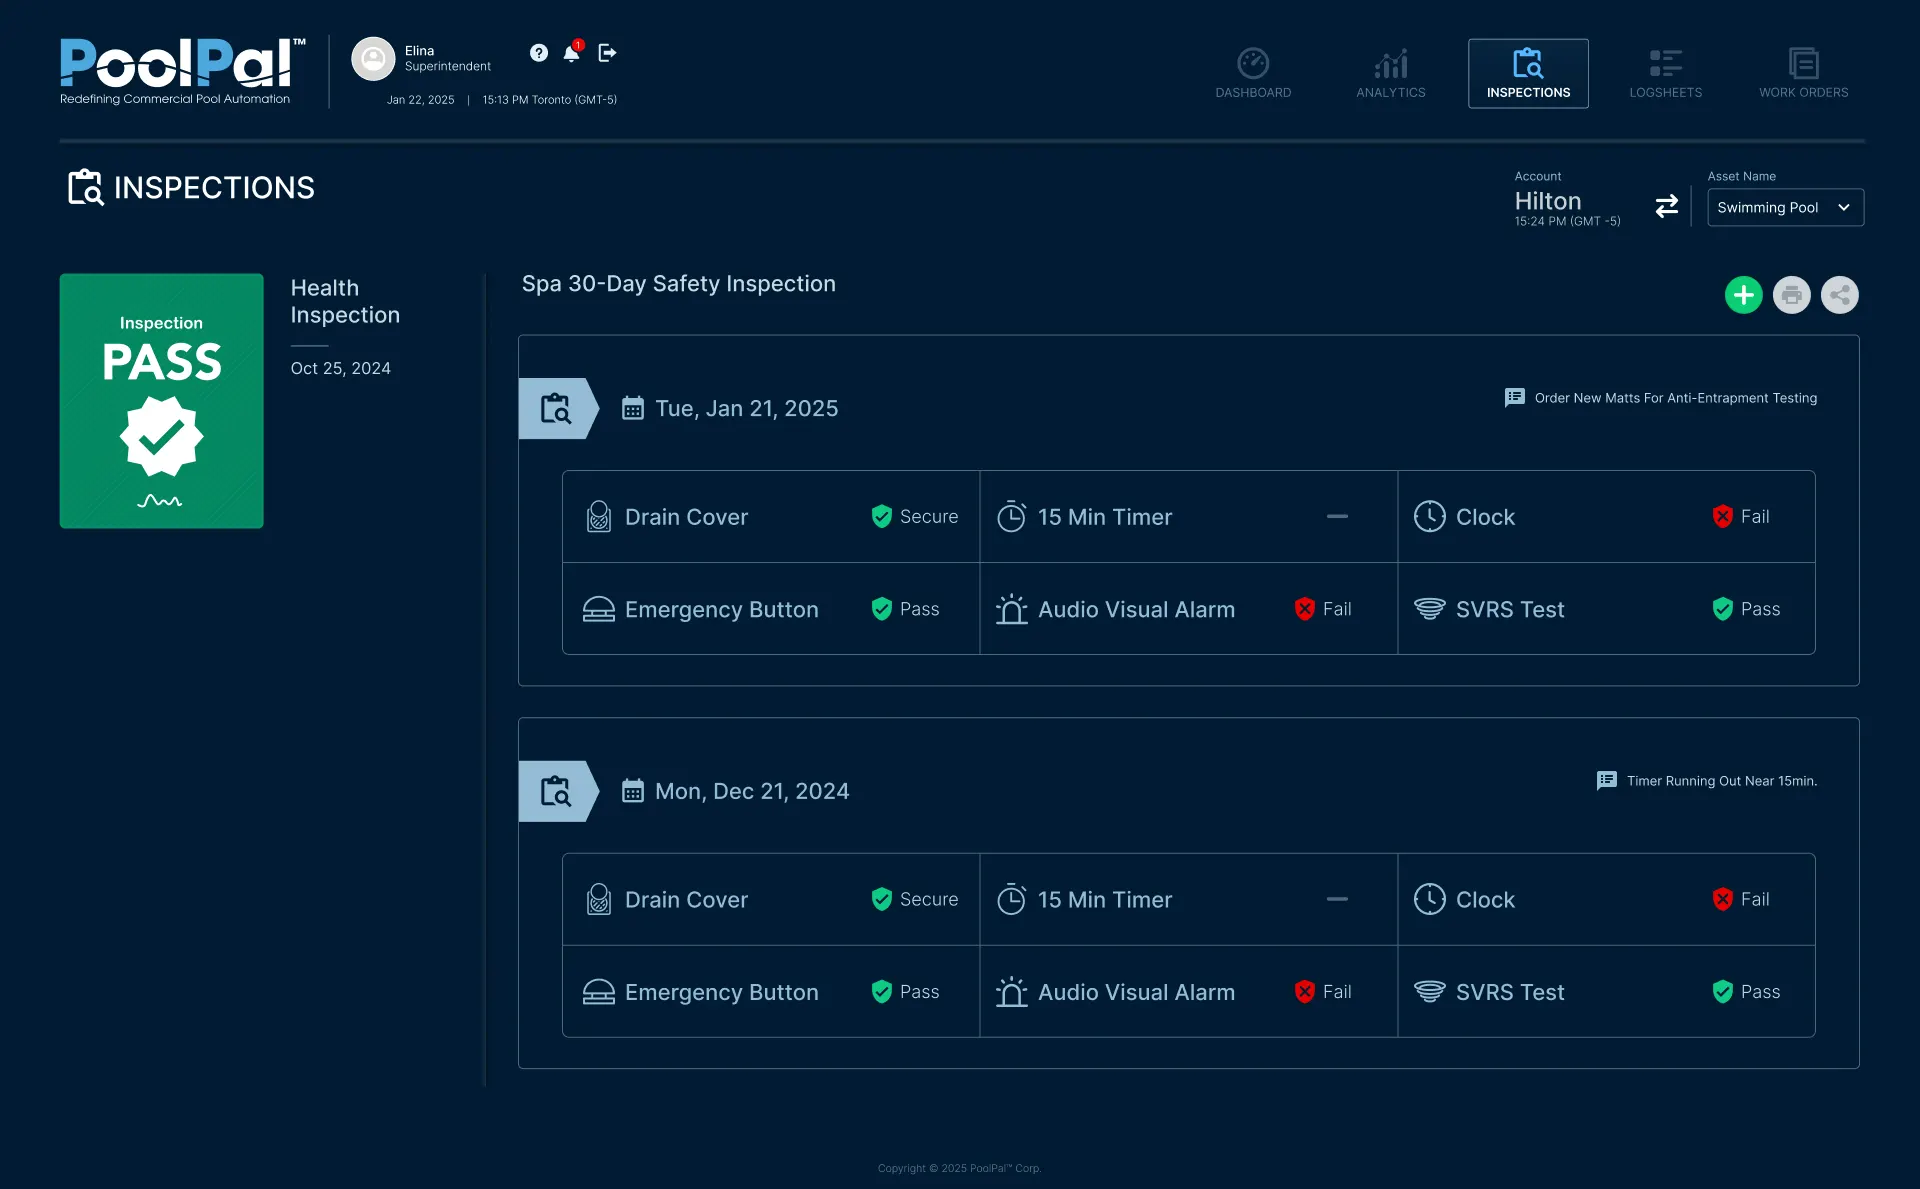
Operational Records & Insights
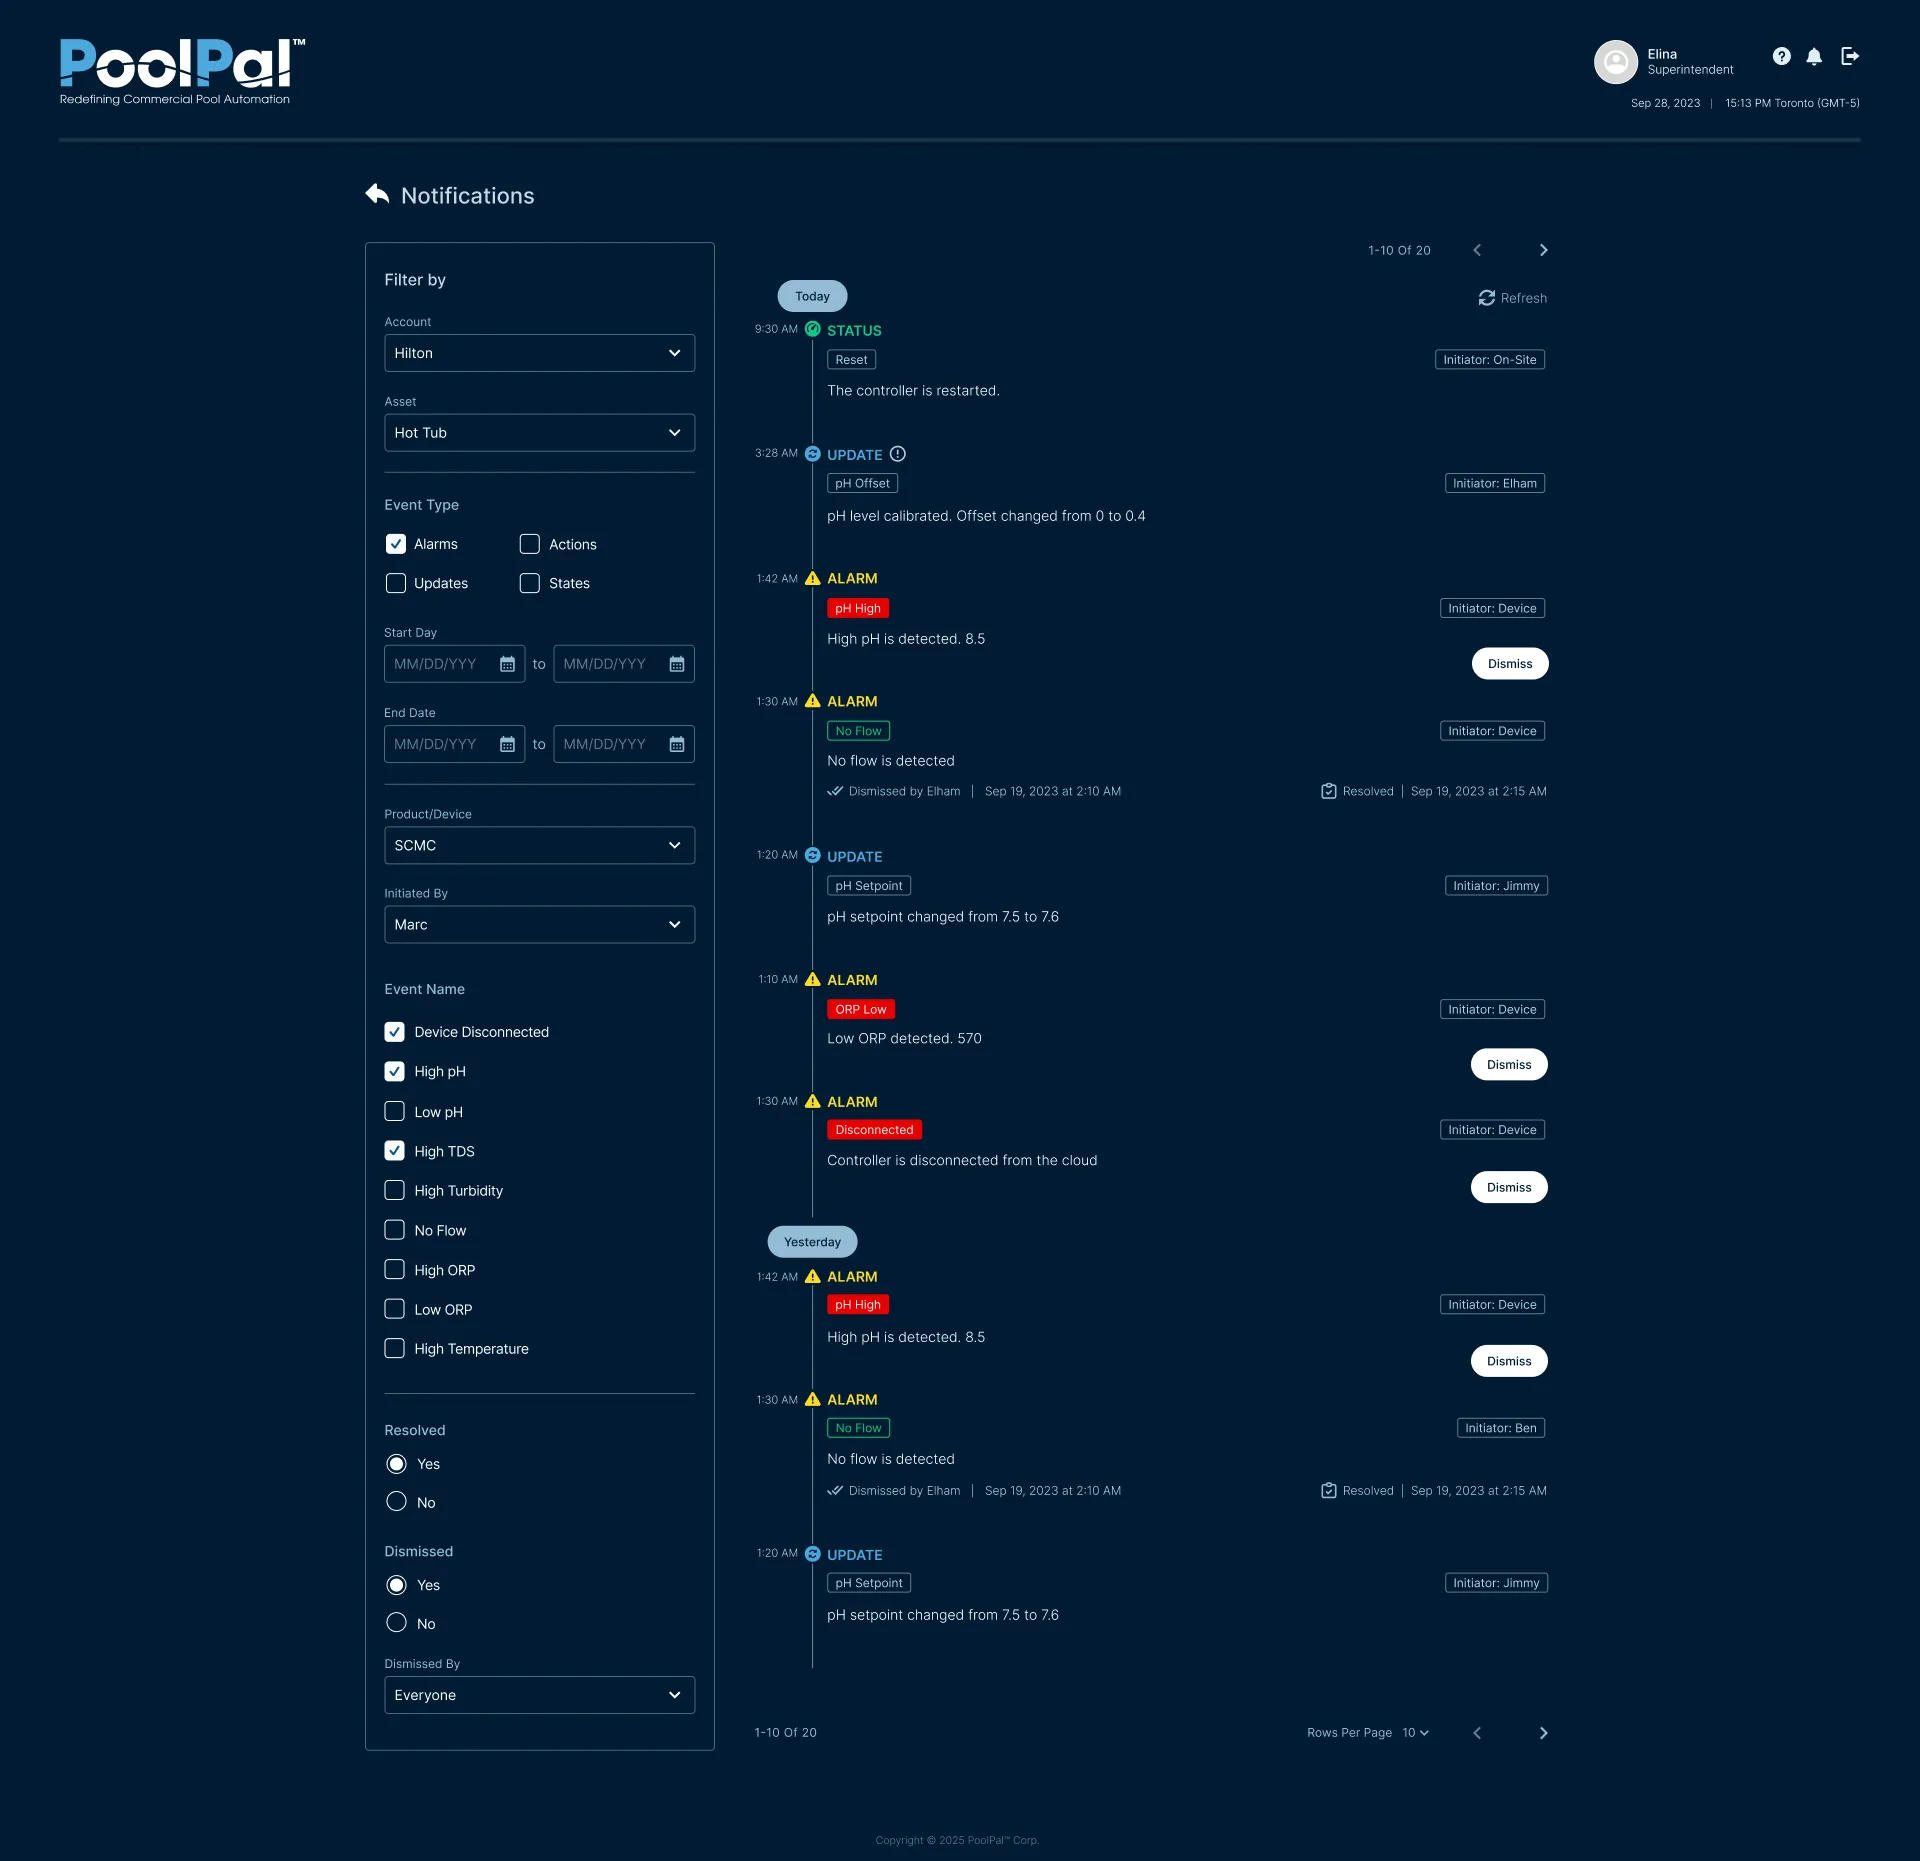
Beyond real-time monitoring and device control, I designed interfaces that helped operators review historical performance, document daily conditions, track safety inspections, and follow system events over time.
These views extended the platform from live operational visibility into ongoing record-keeping, issue tracking, and informed decision-making.
Cross-device Clarity
Adaptive Layout
Consistent Actions
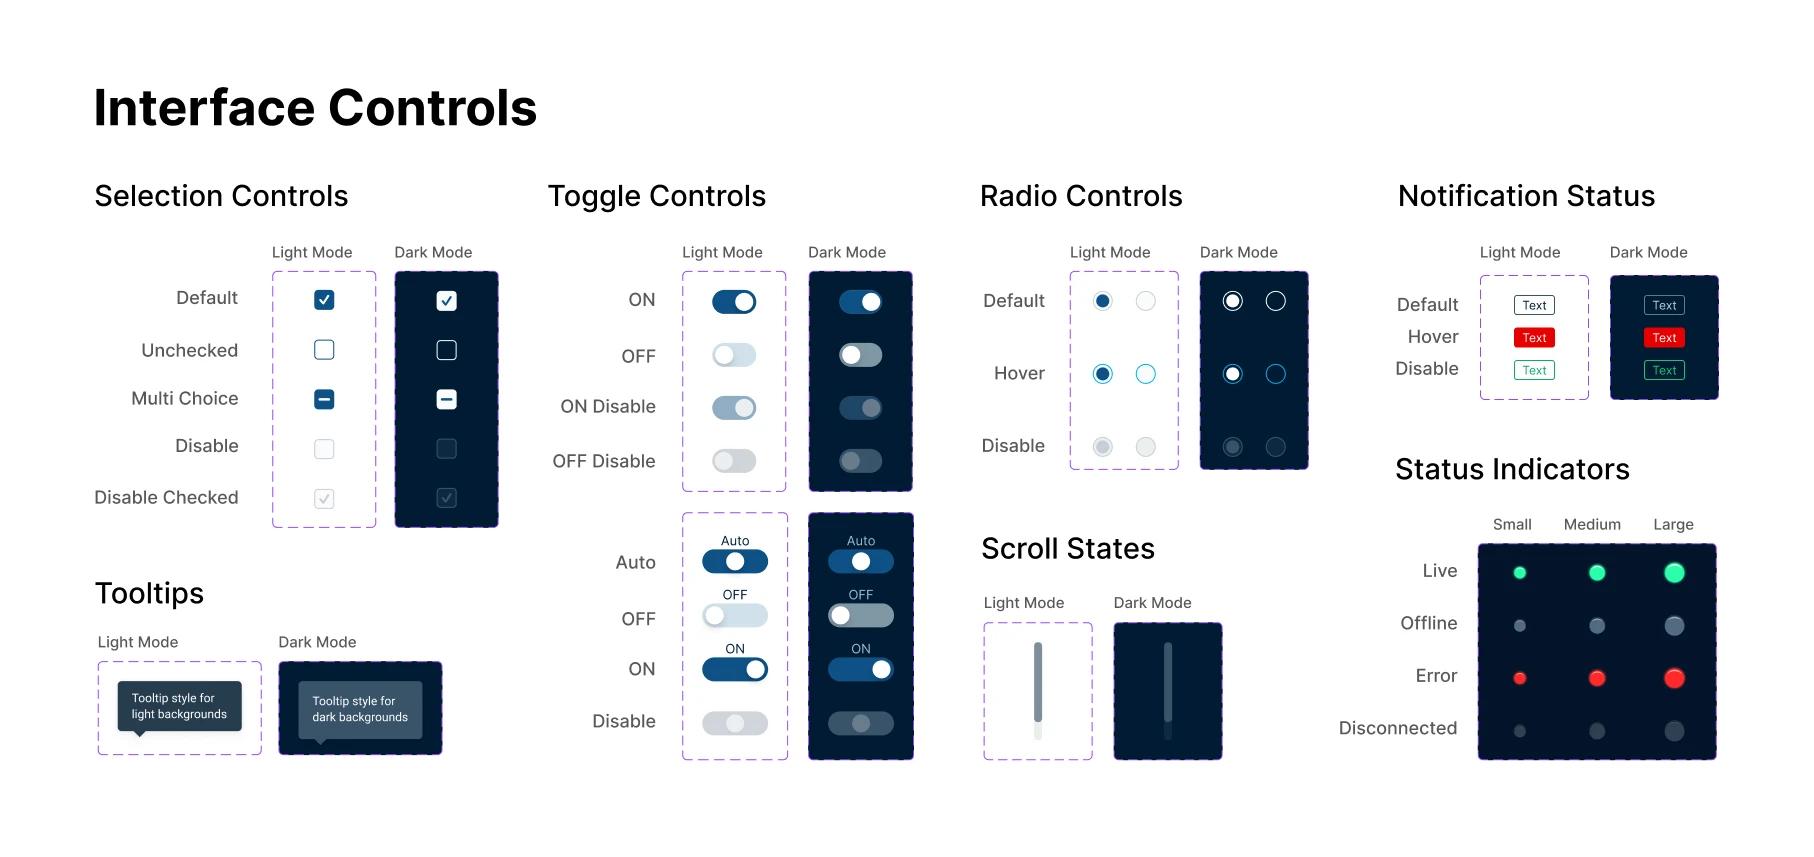
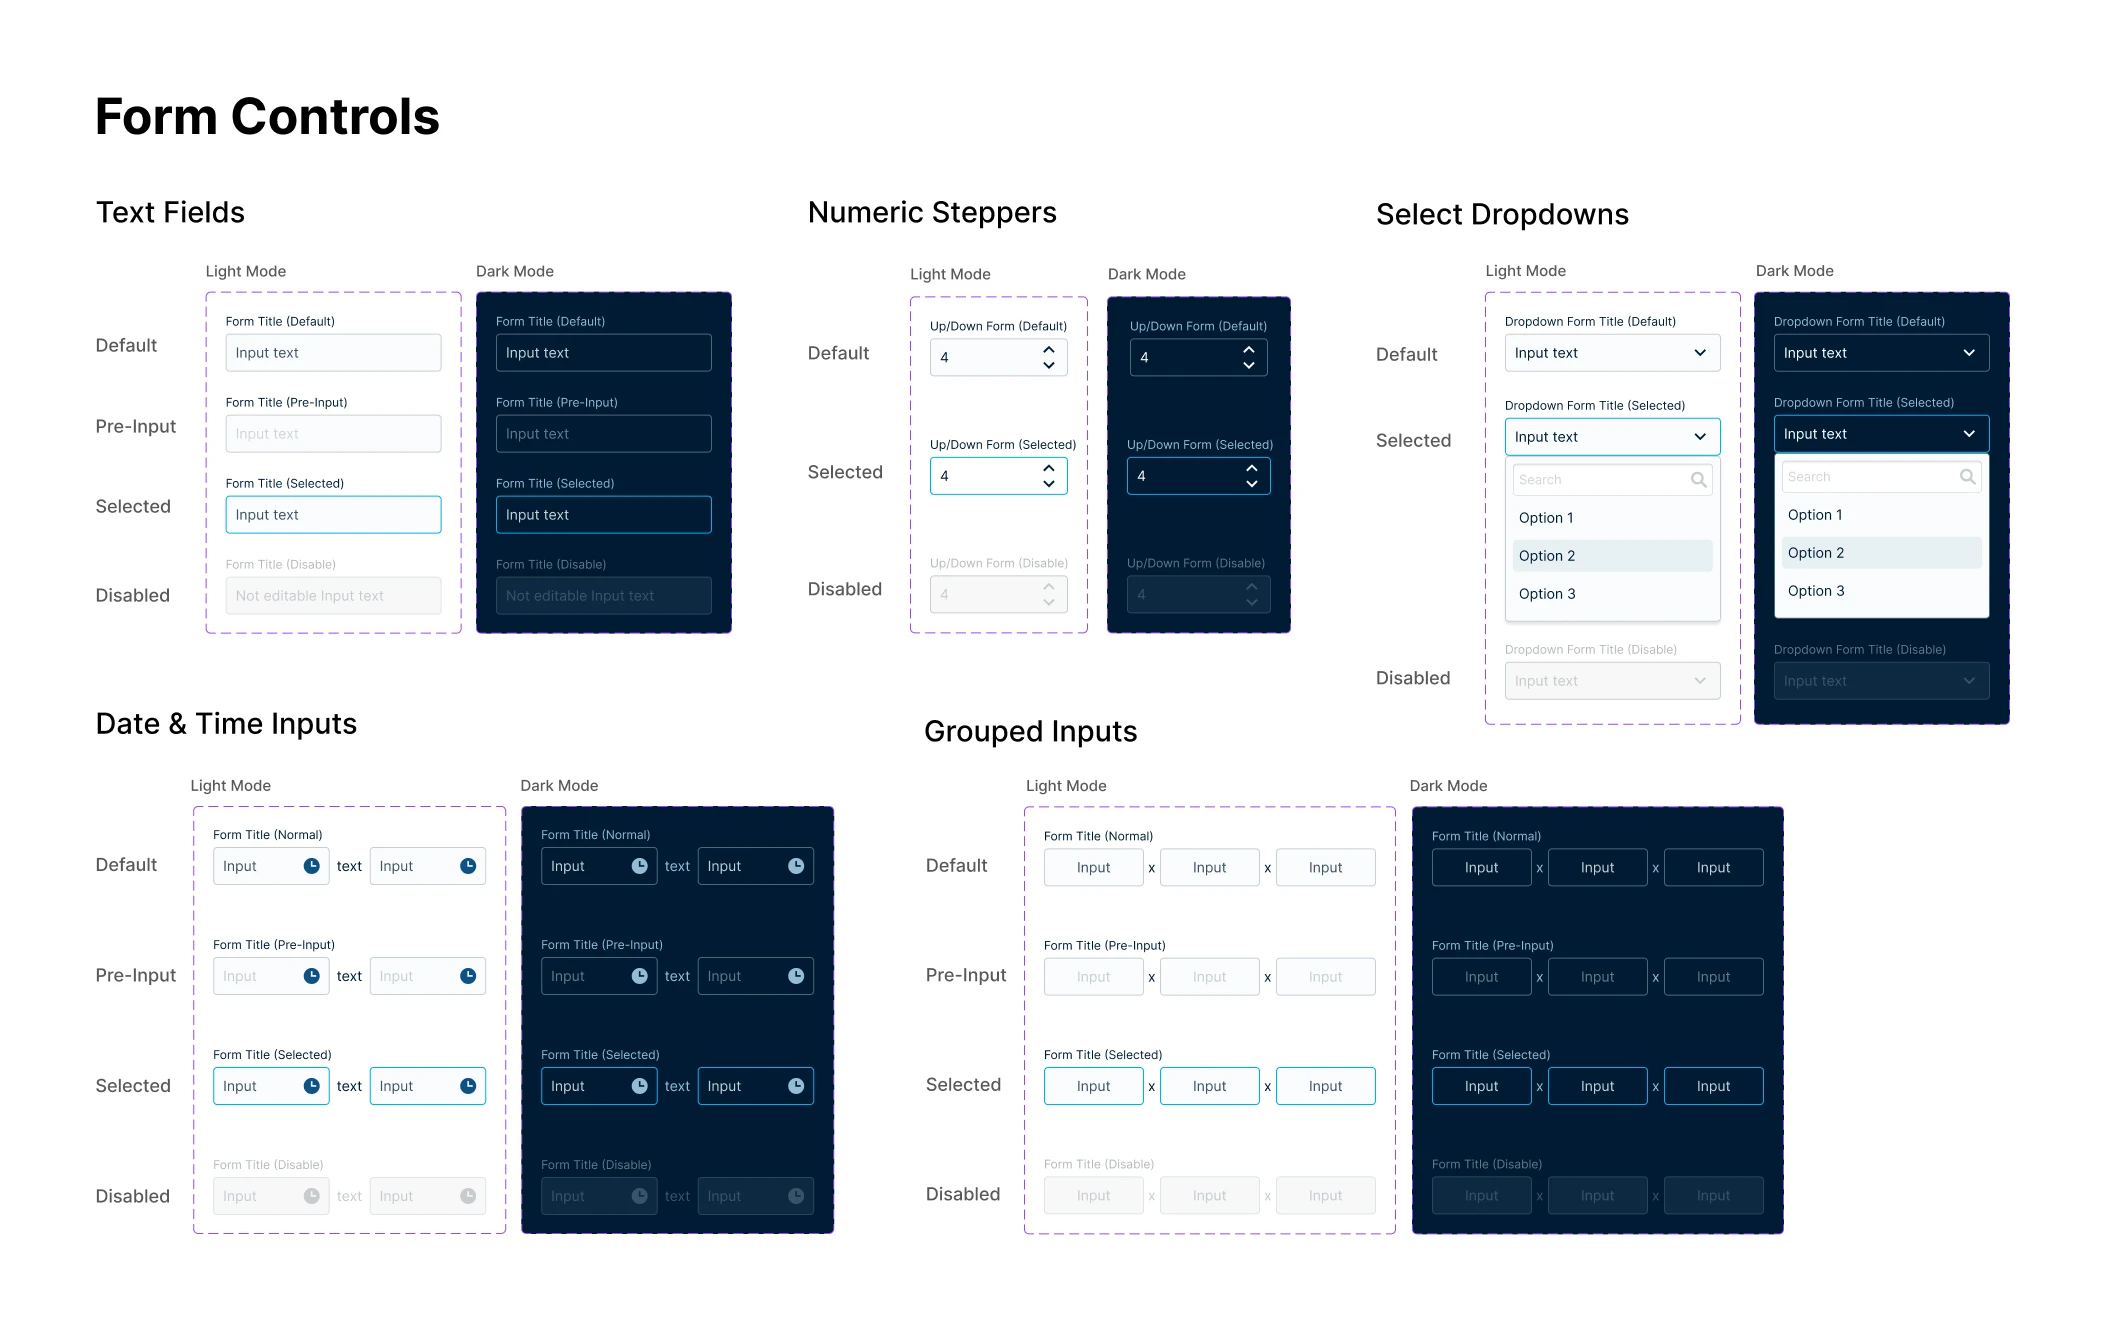
UI Logic & Design System
To make a complex operational platform easier to use, I built a consistent UI system across dashboards, admin tools, and device settings. This helped users quickly understand live status, alerts, critical data, and available actions across the platform.
Applied UI Logic
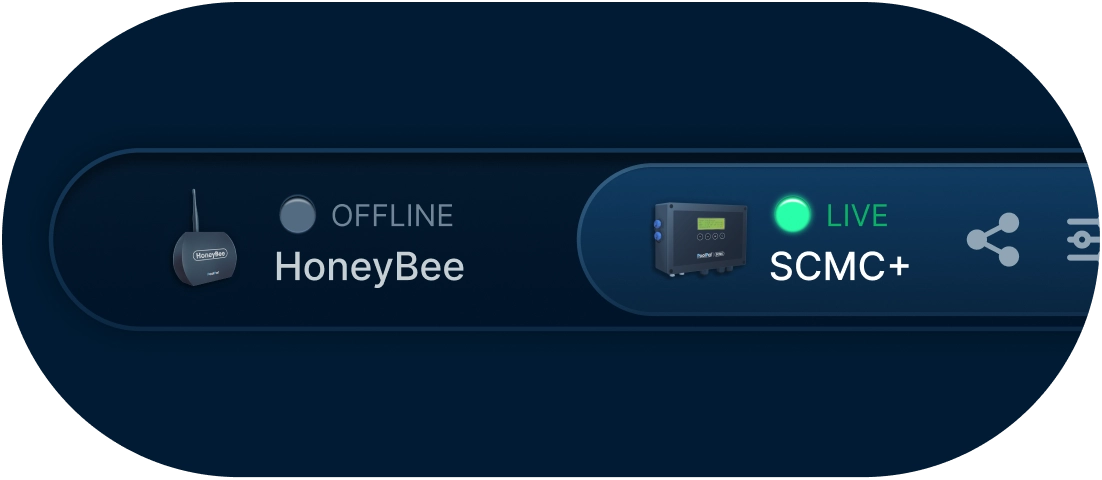
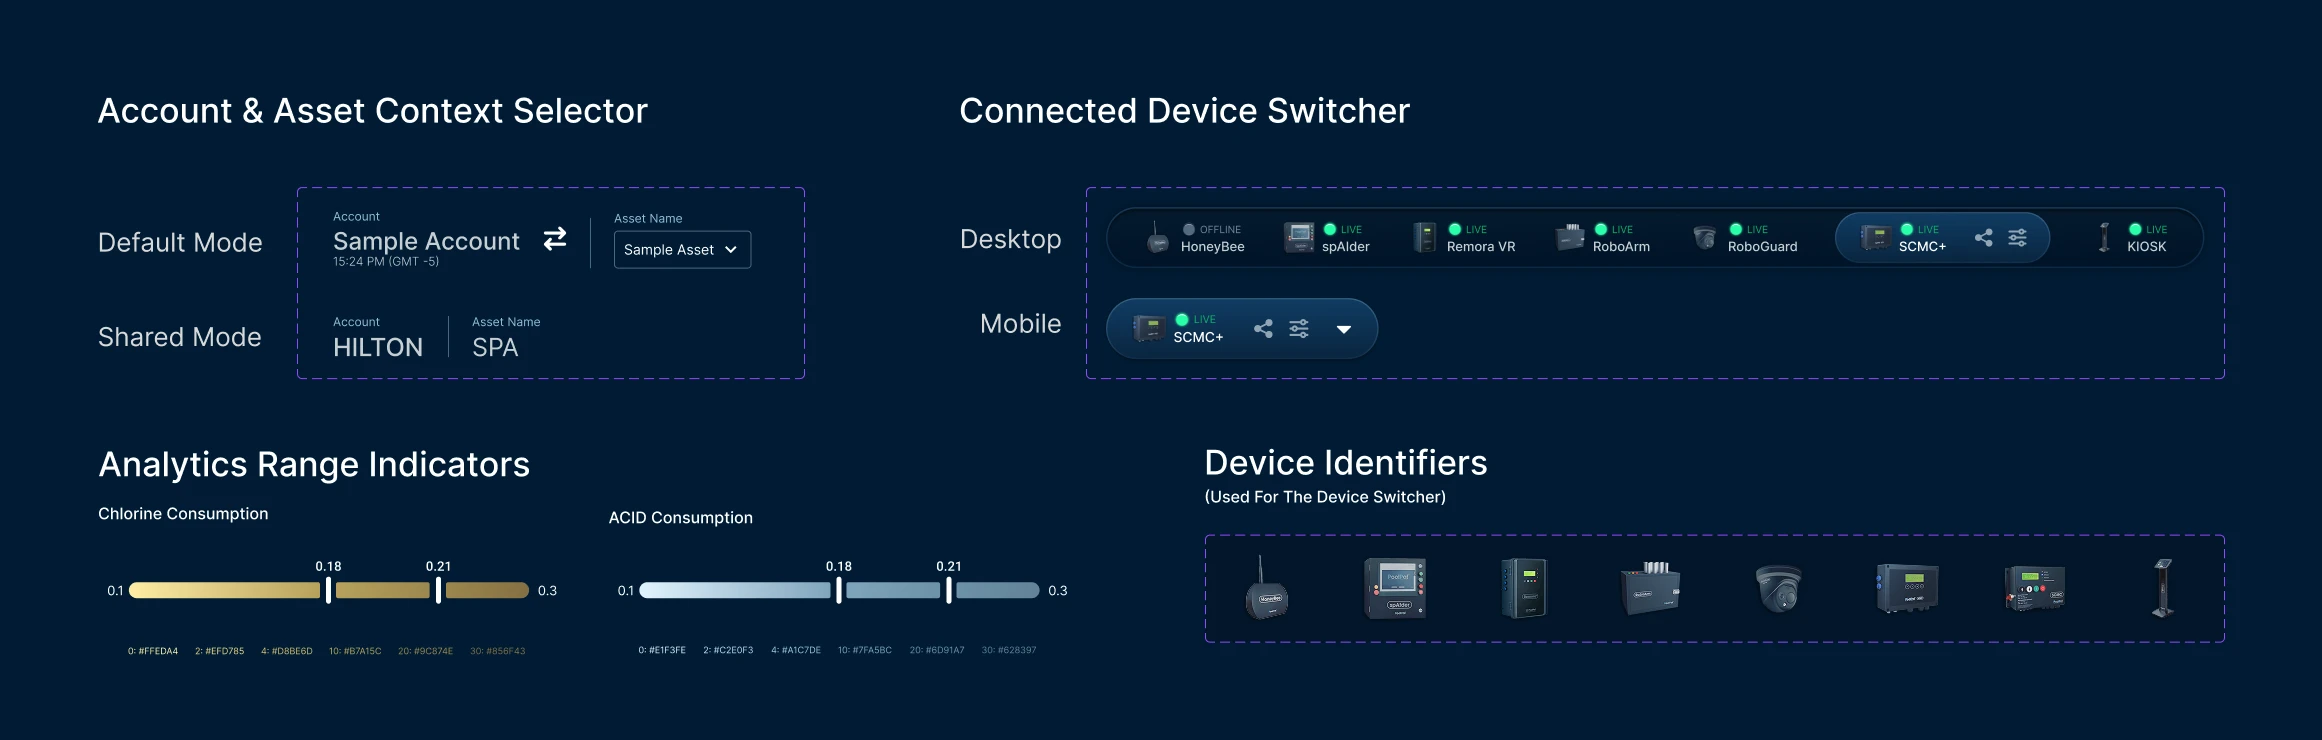
Device Status & Switching
Live device status and quick contextual switching across connected devices.
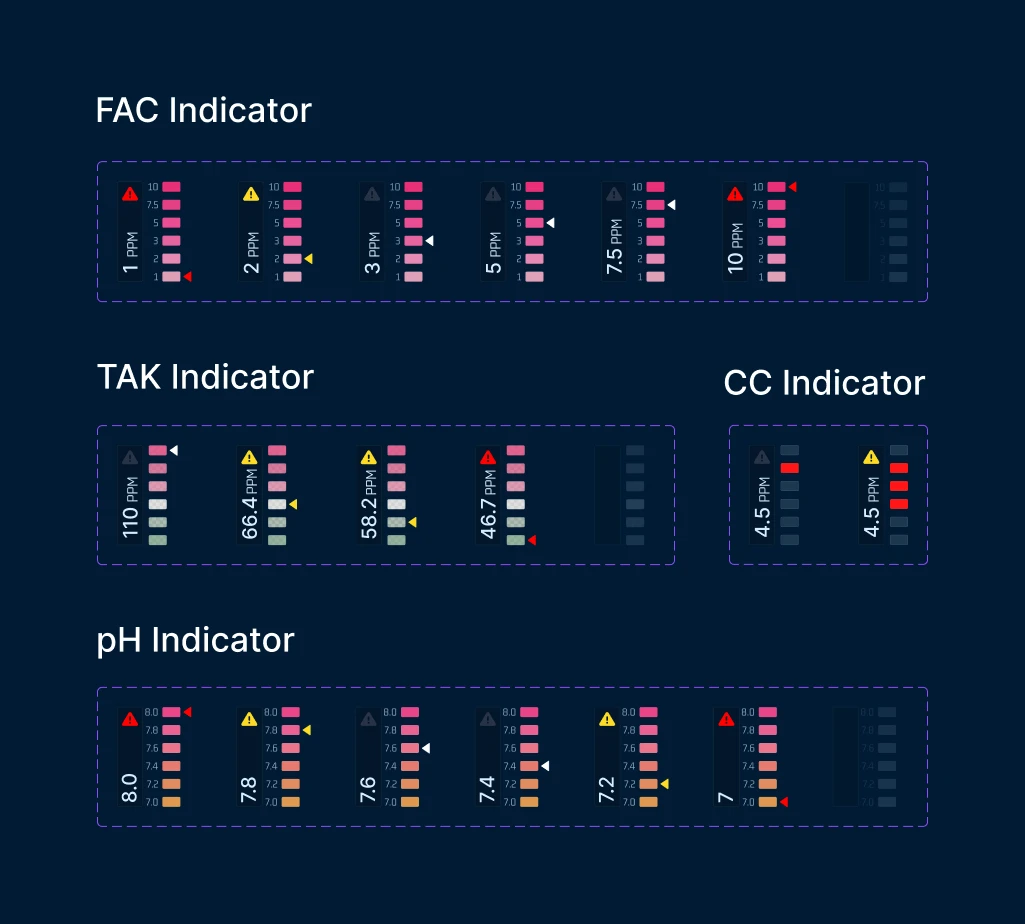
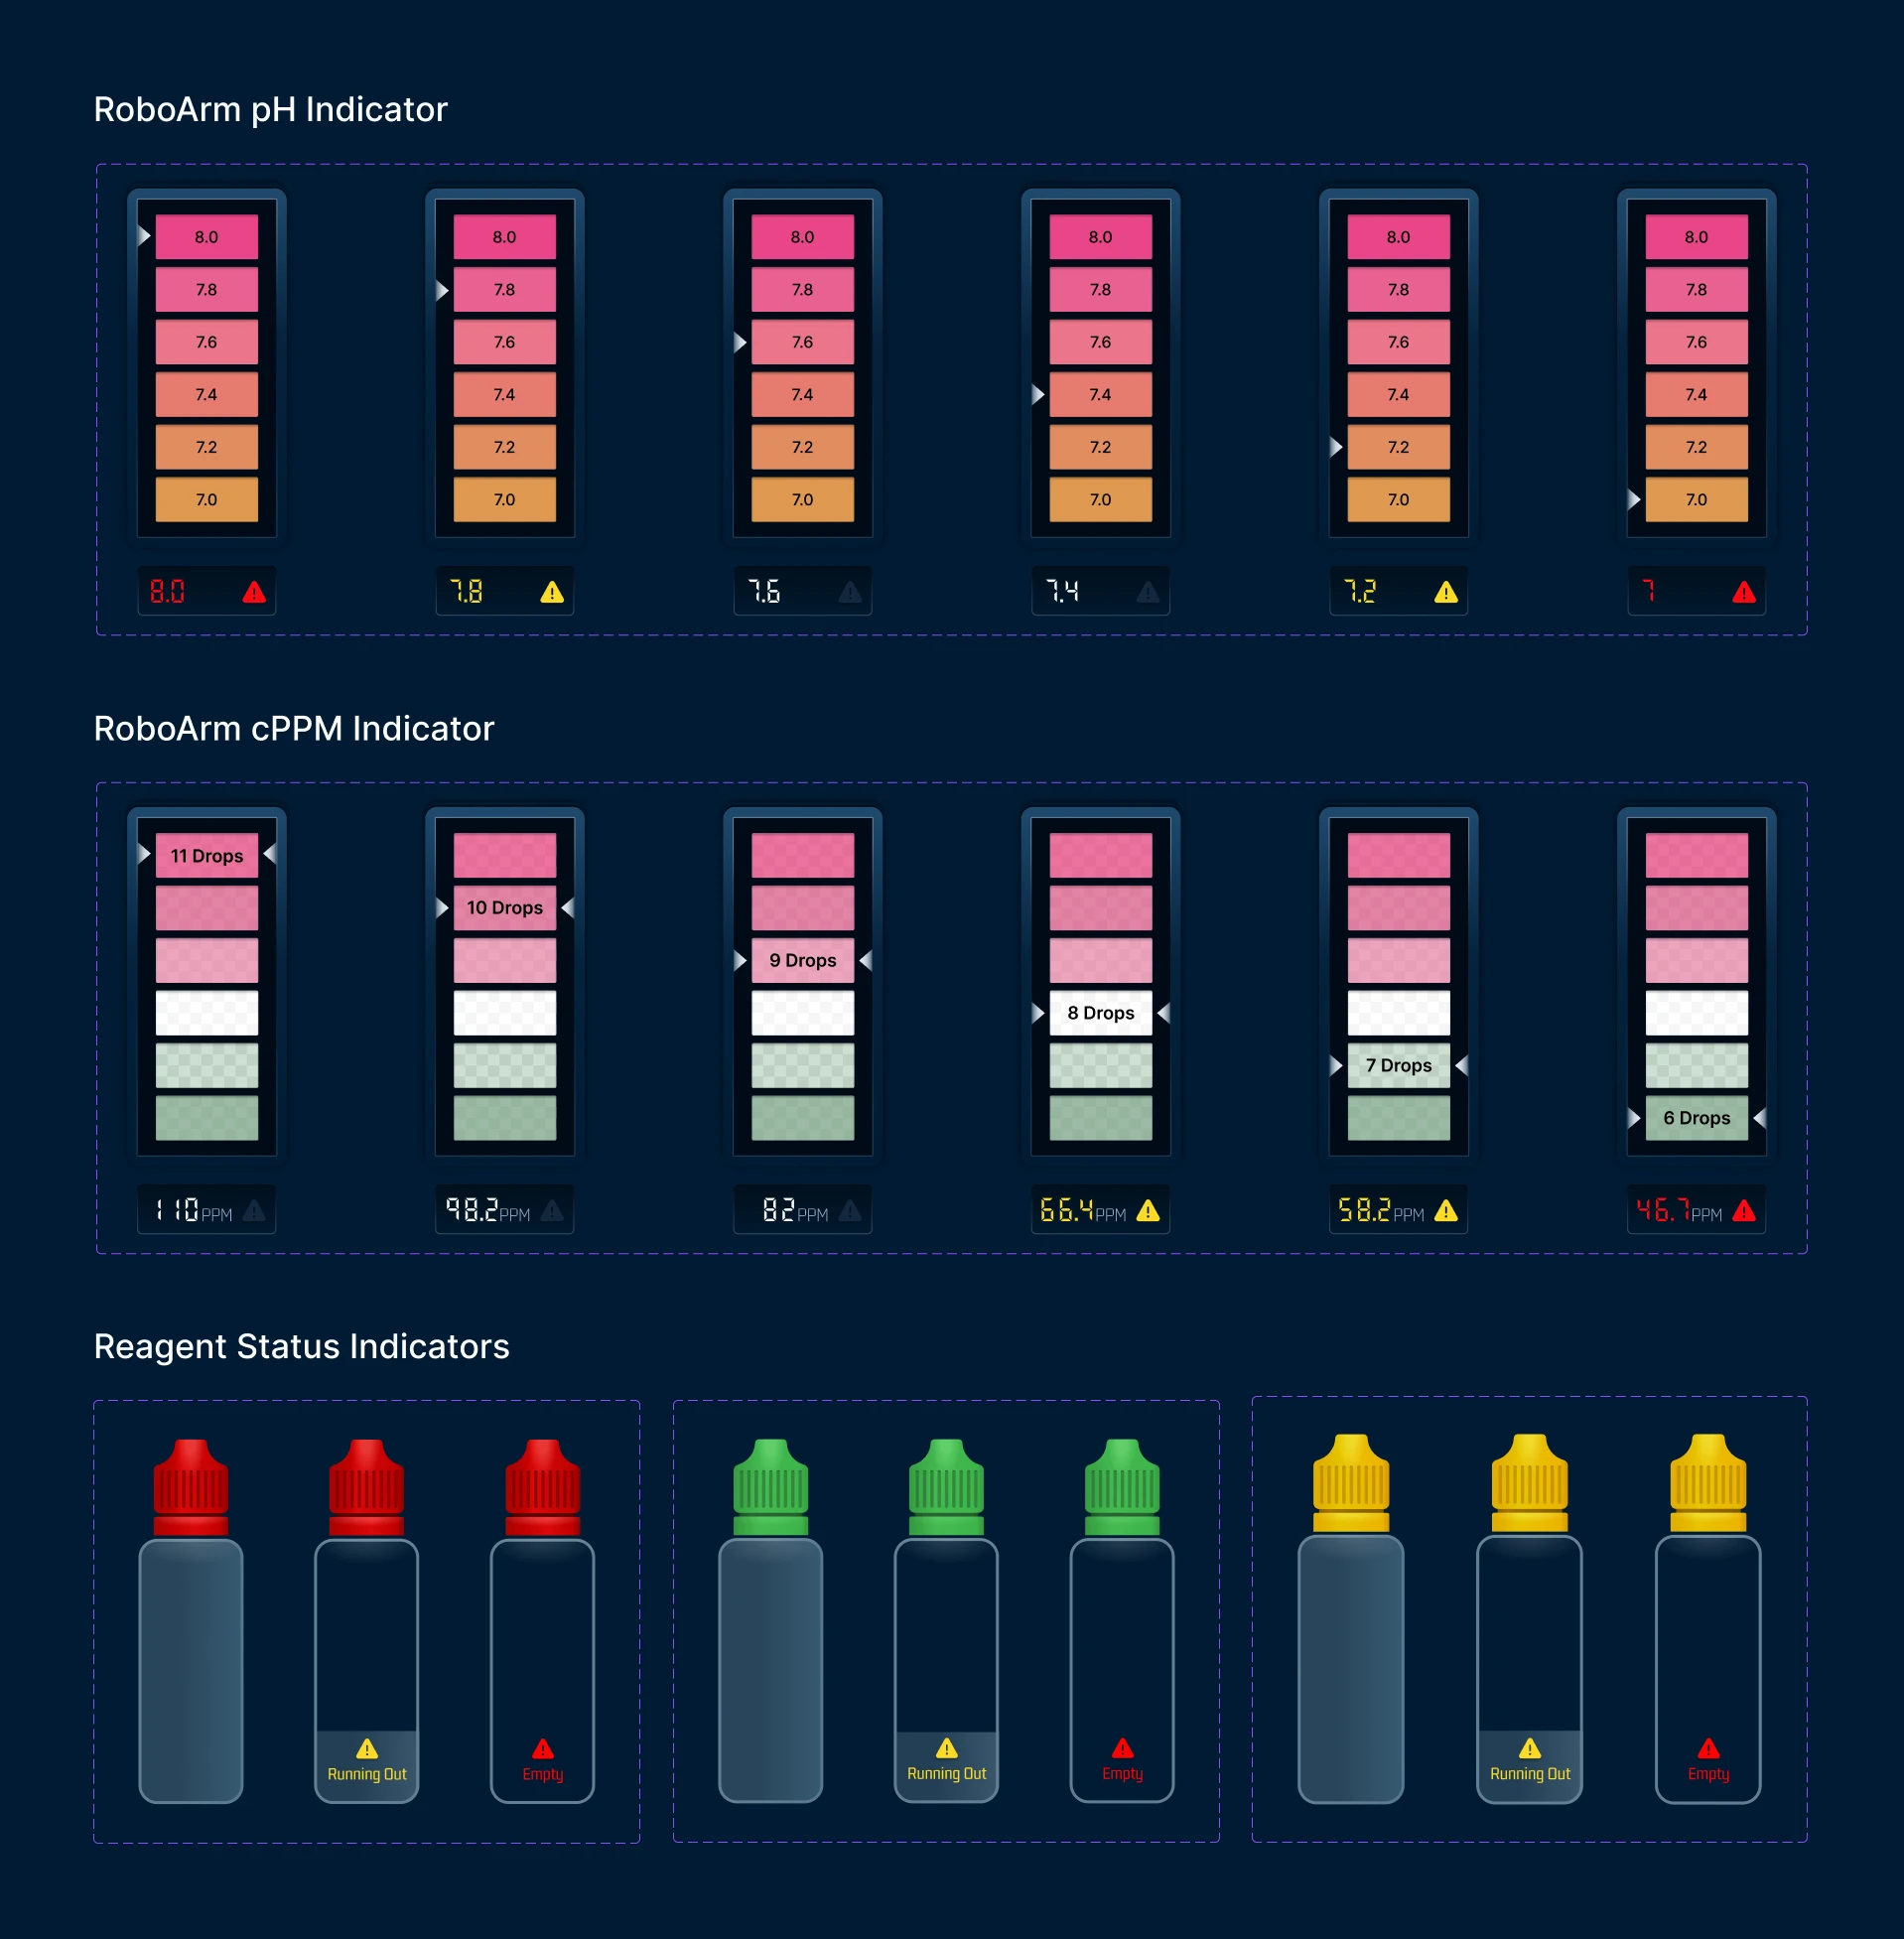
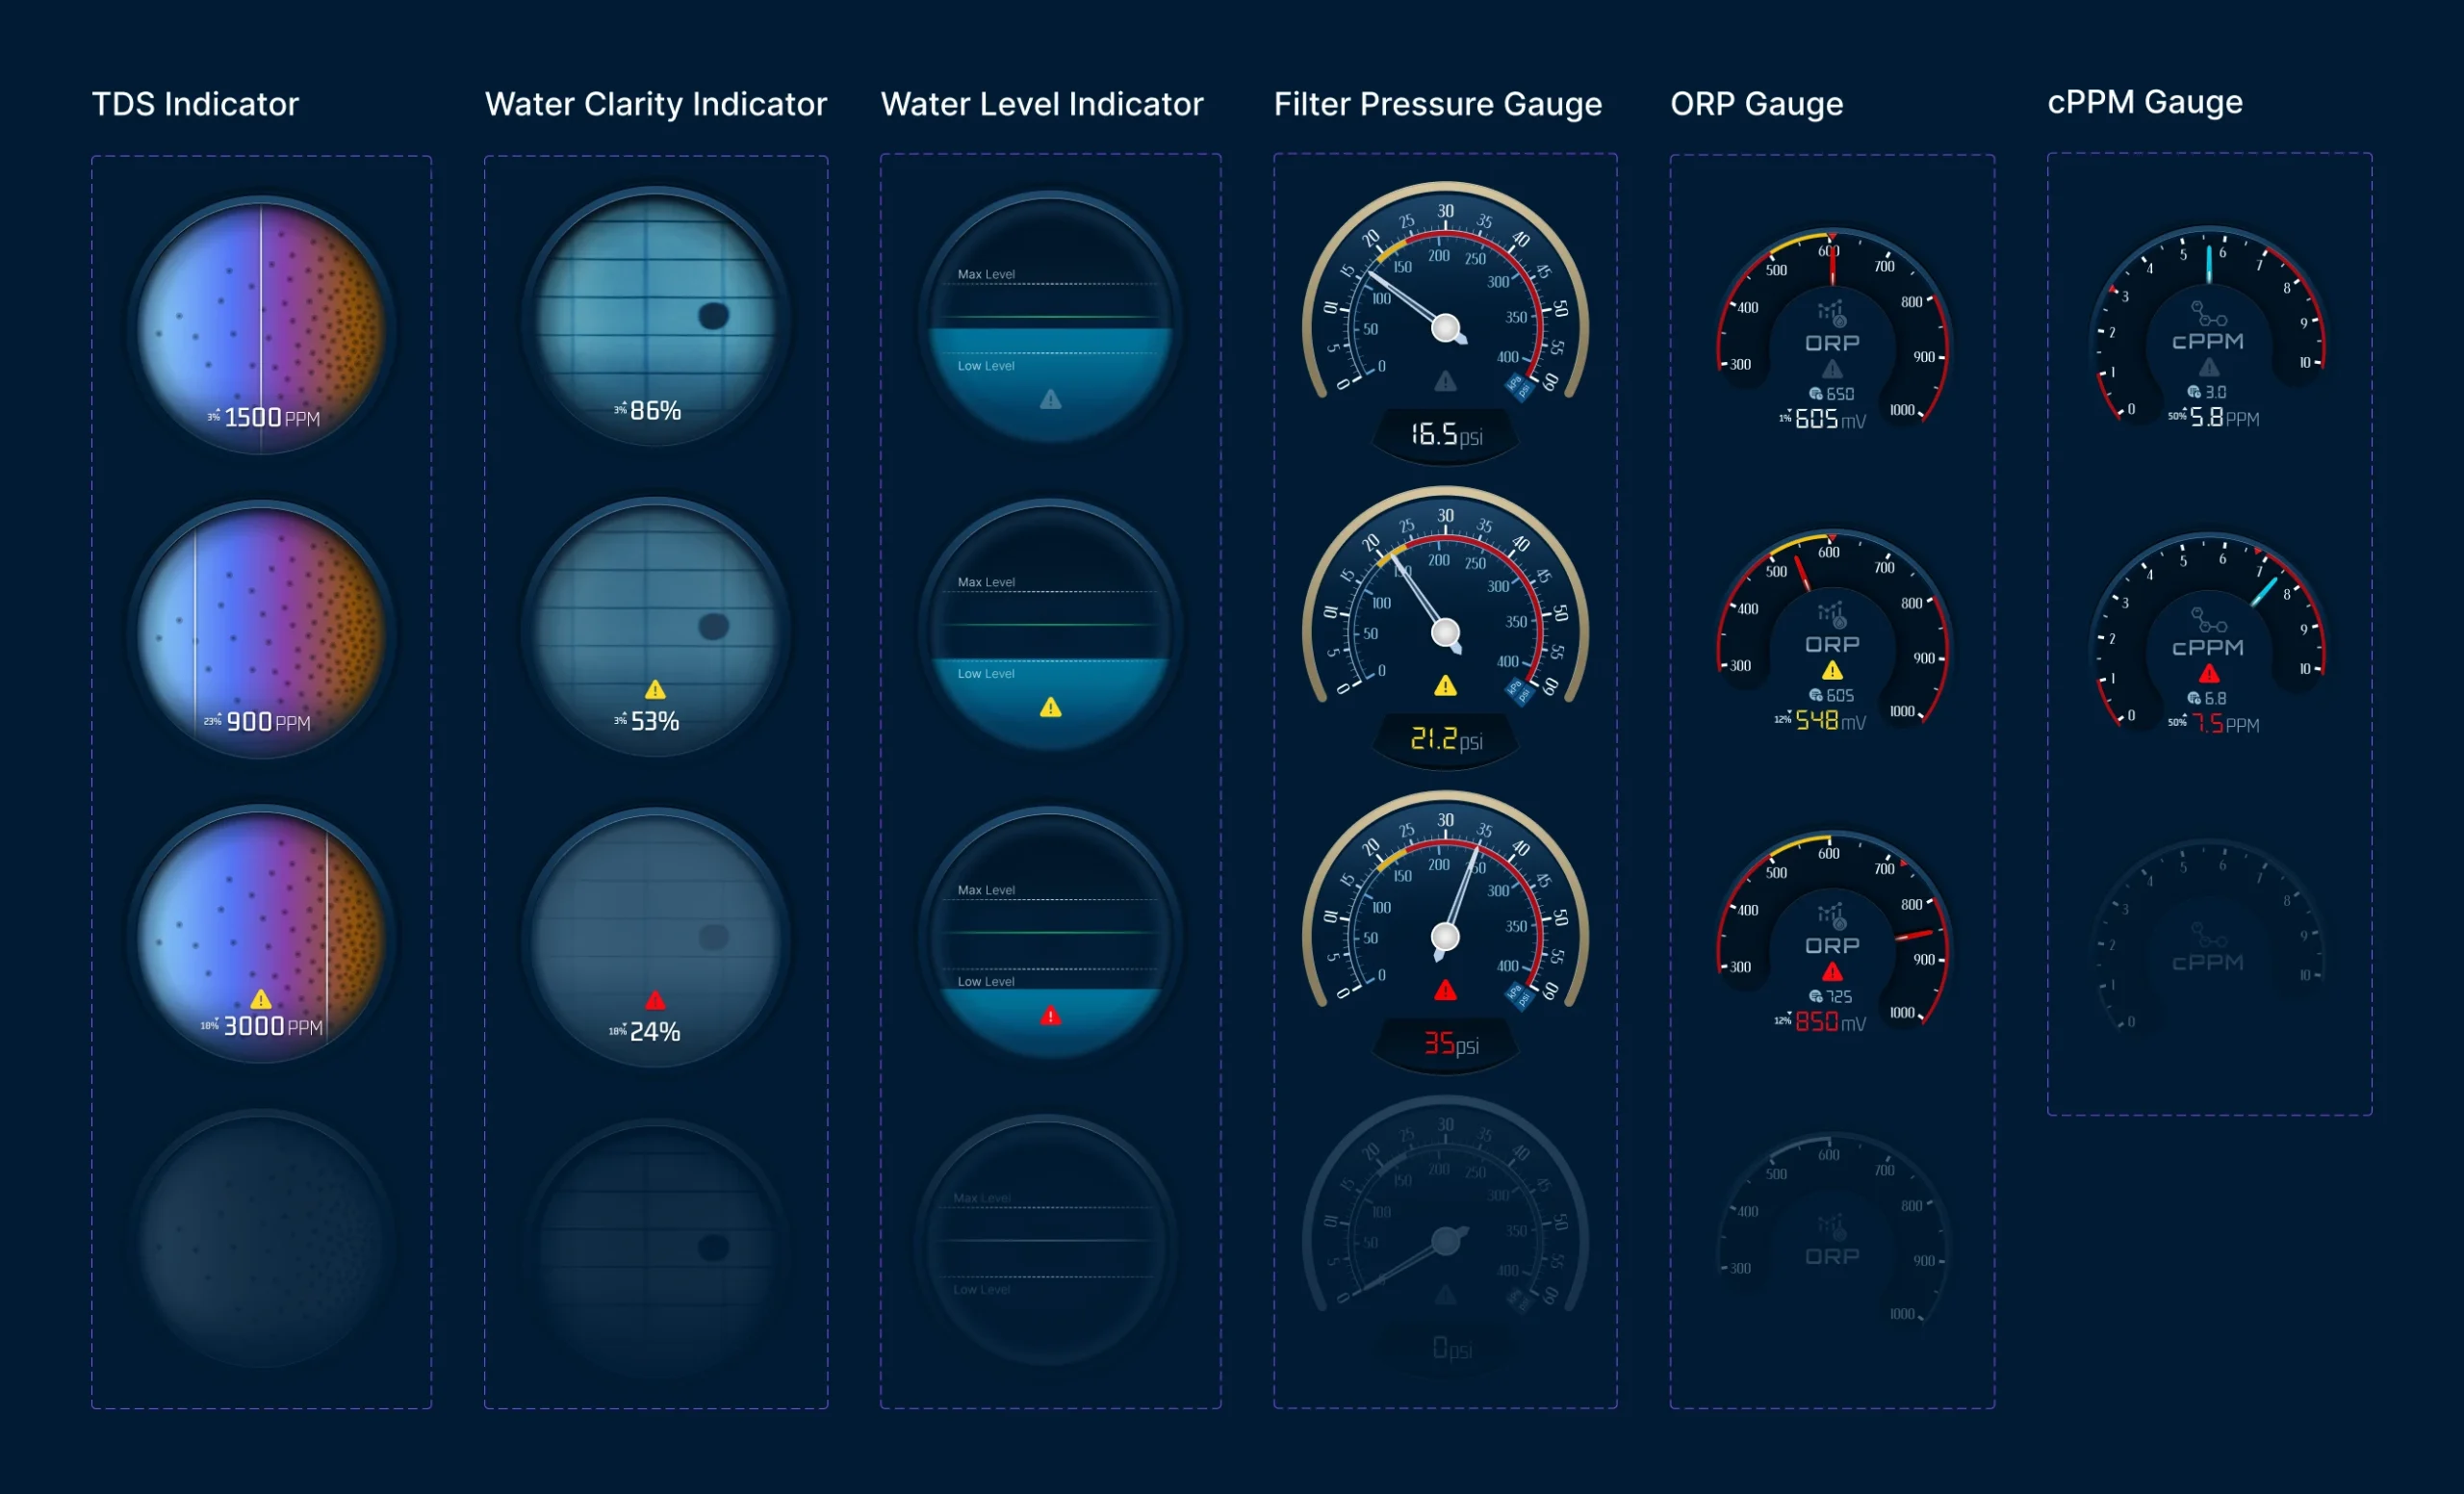
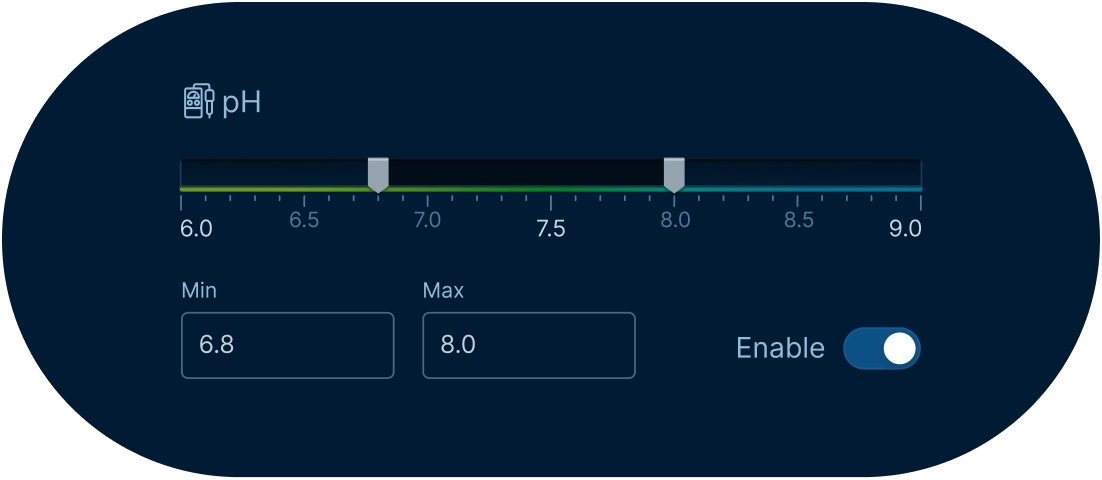
Threshold-Based Alerts
Configurable operating ranges for triggering safety and monitoring alerts.
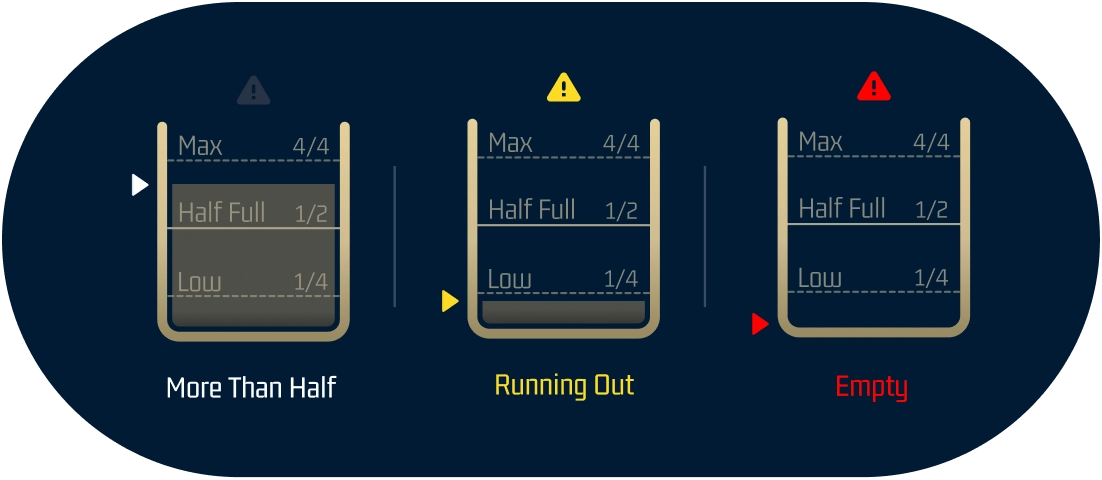
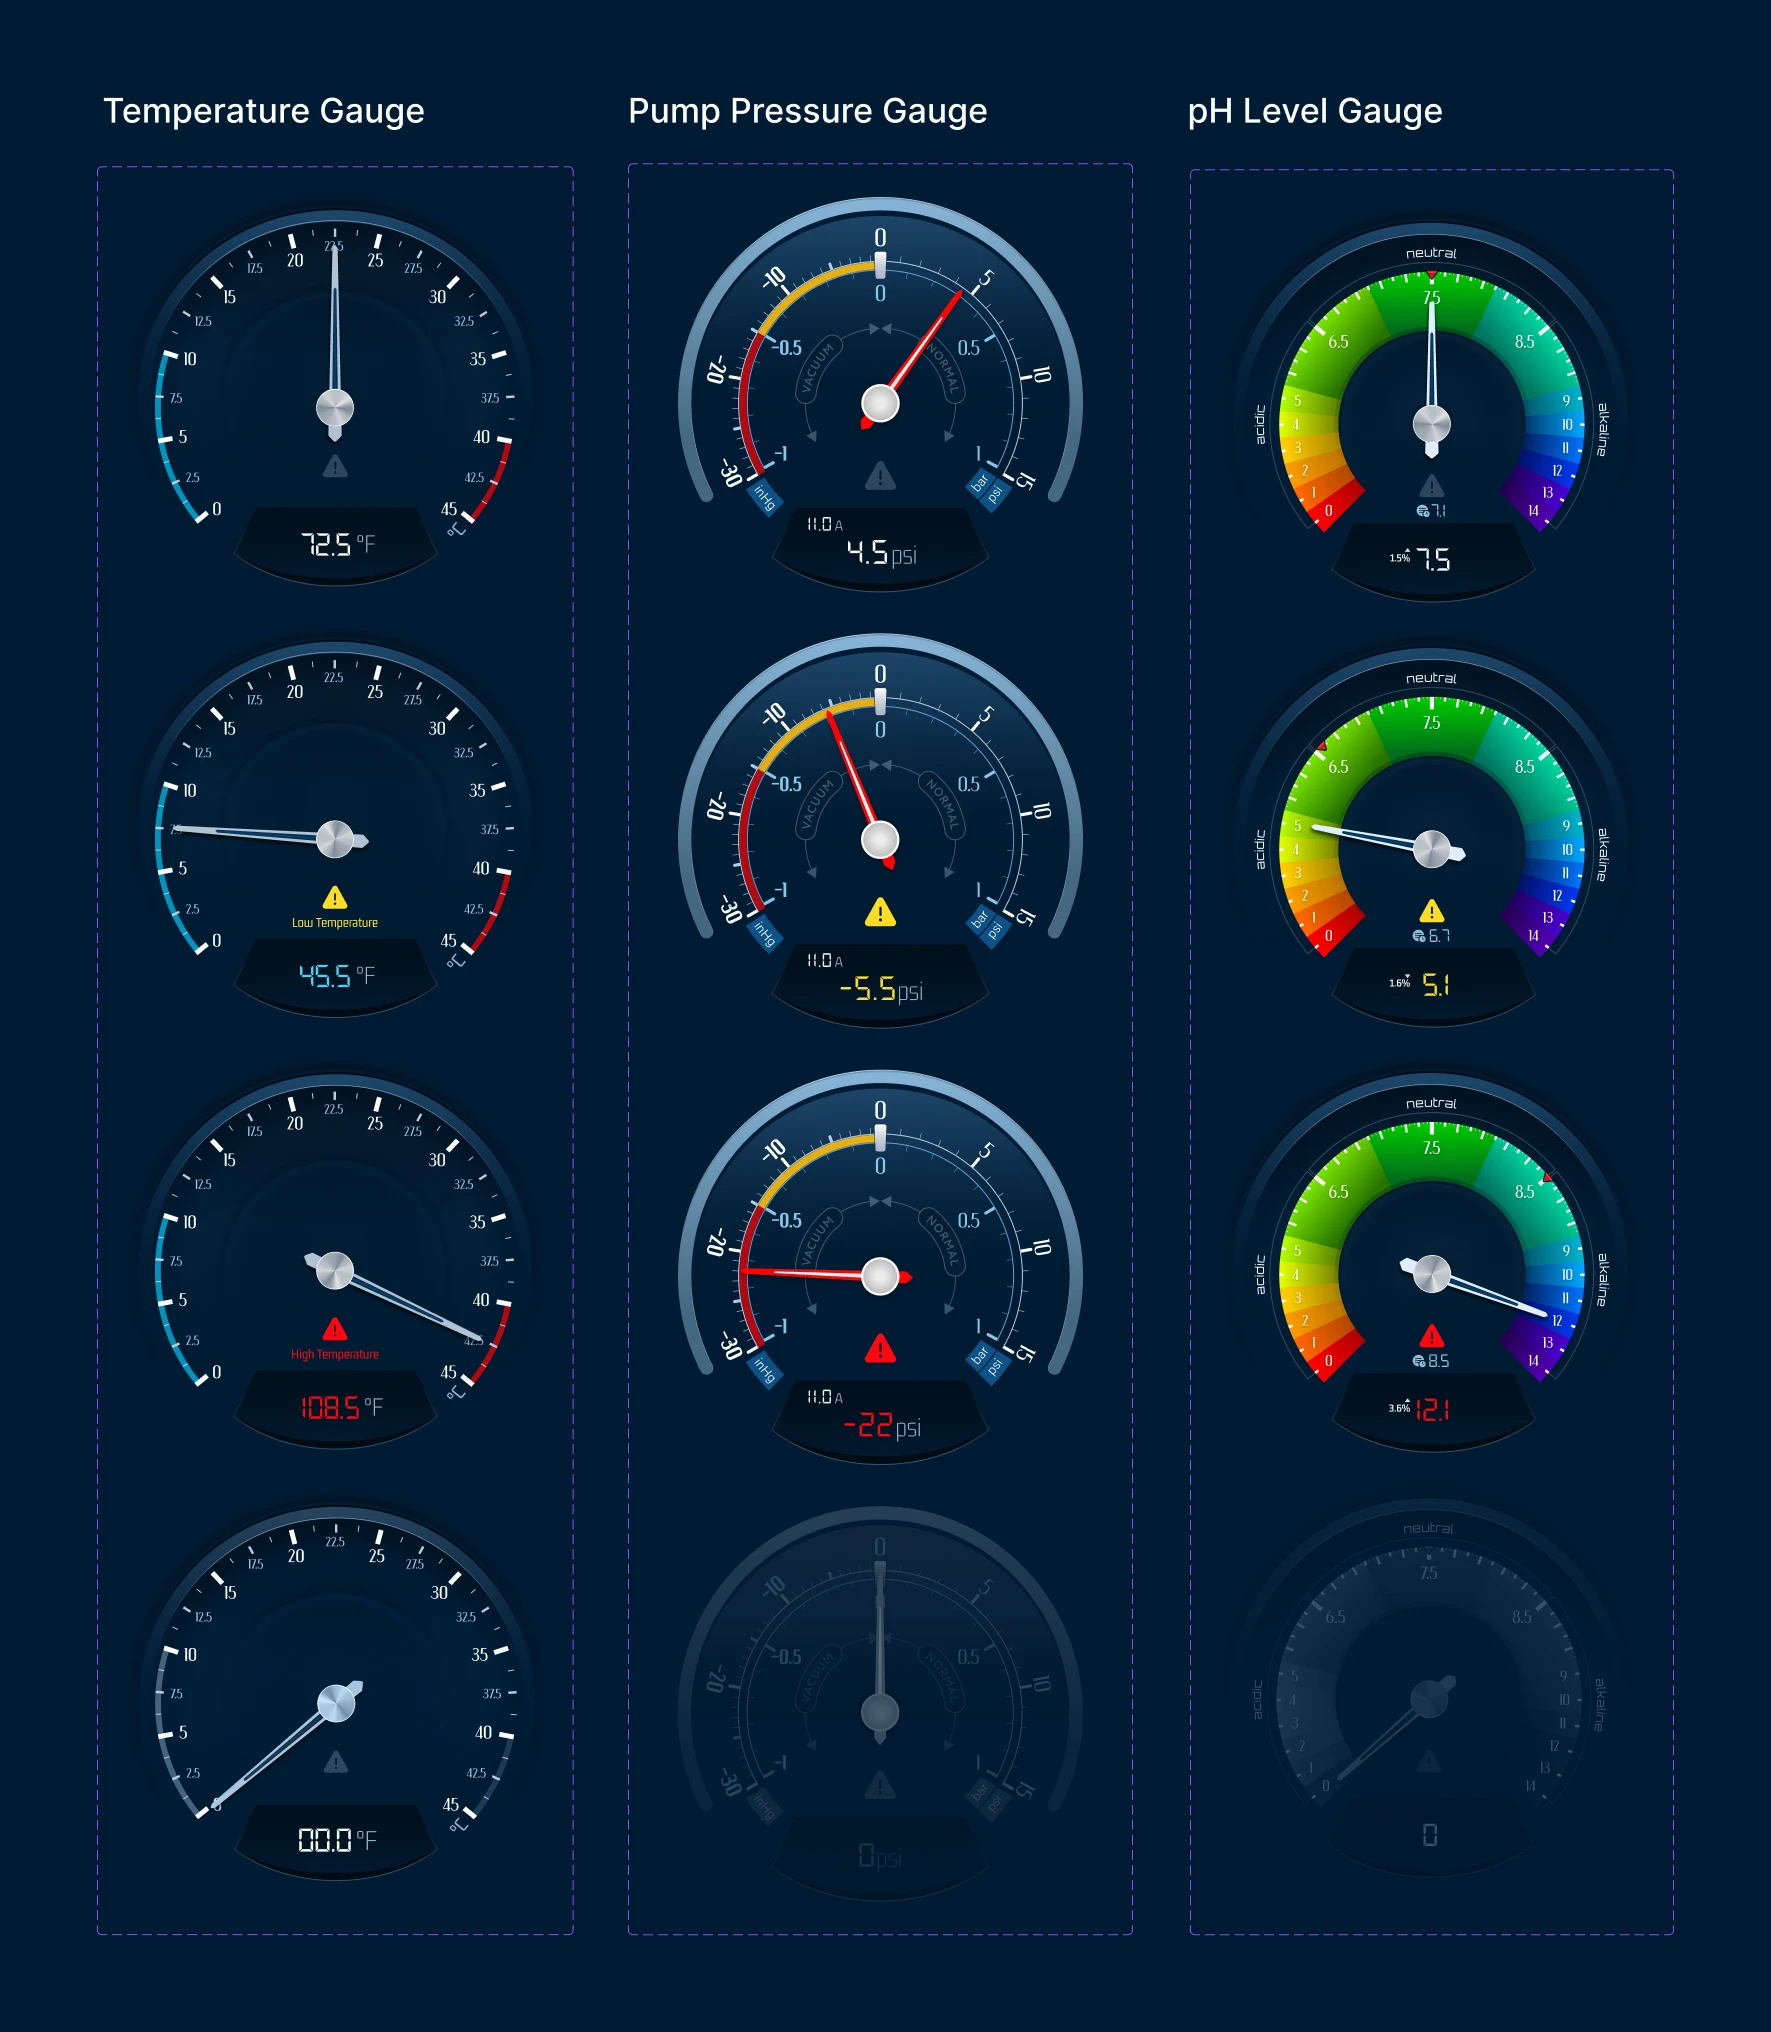
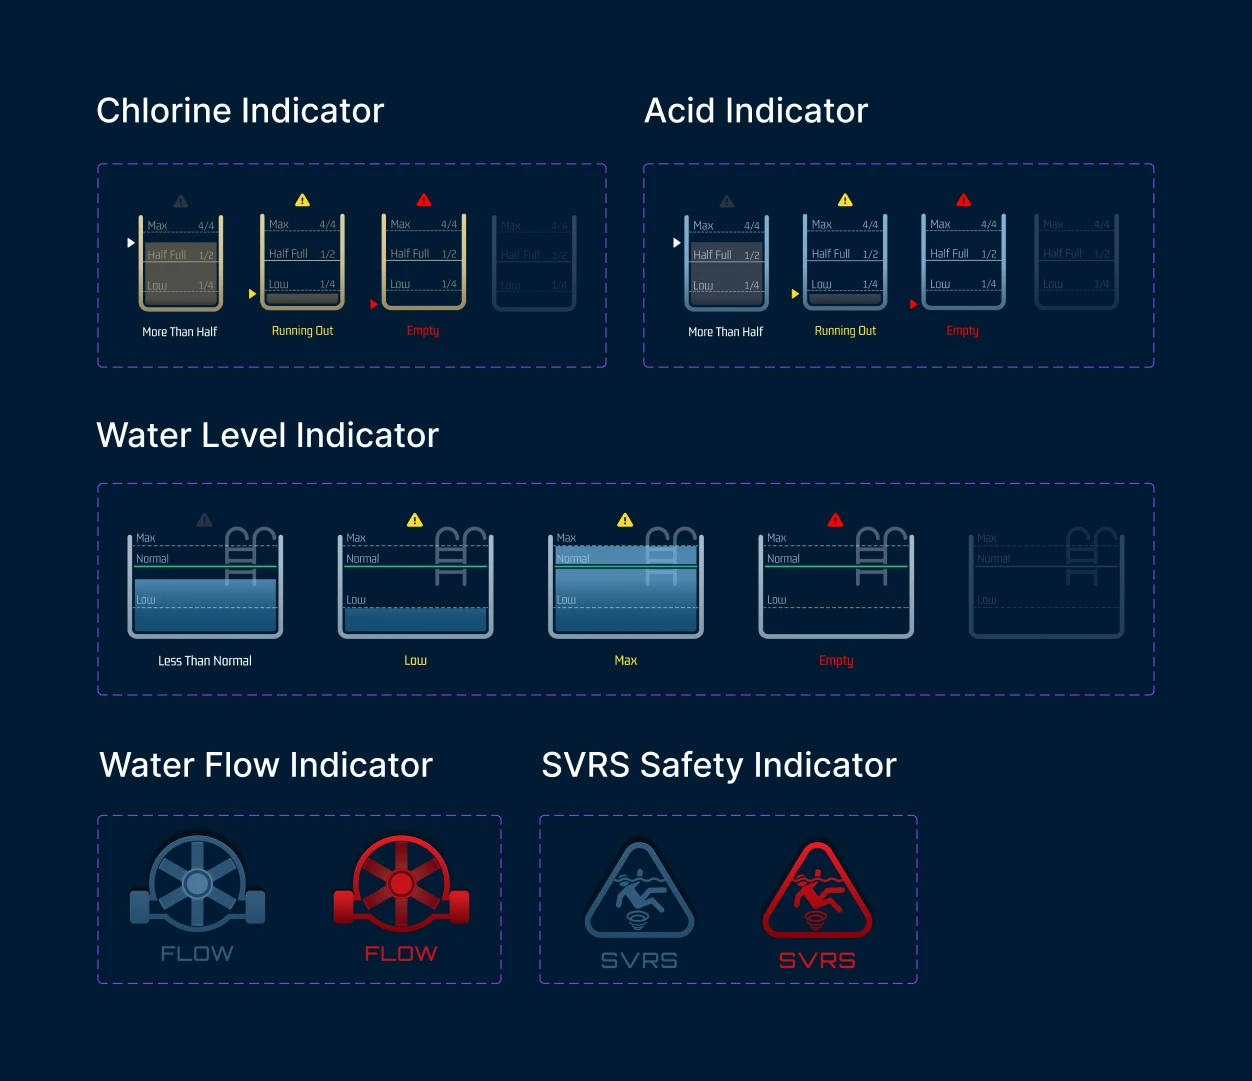
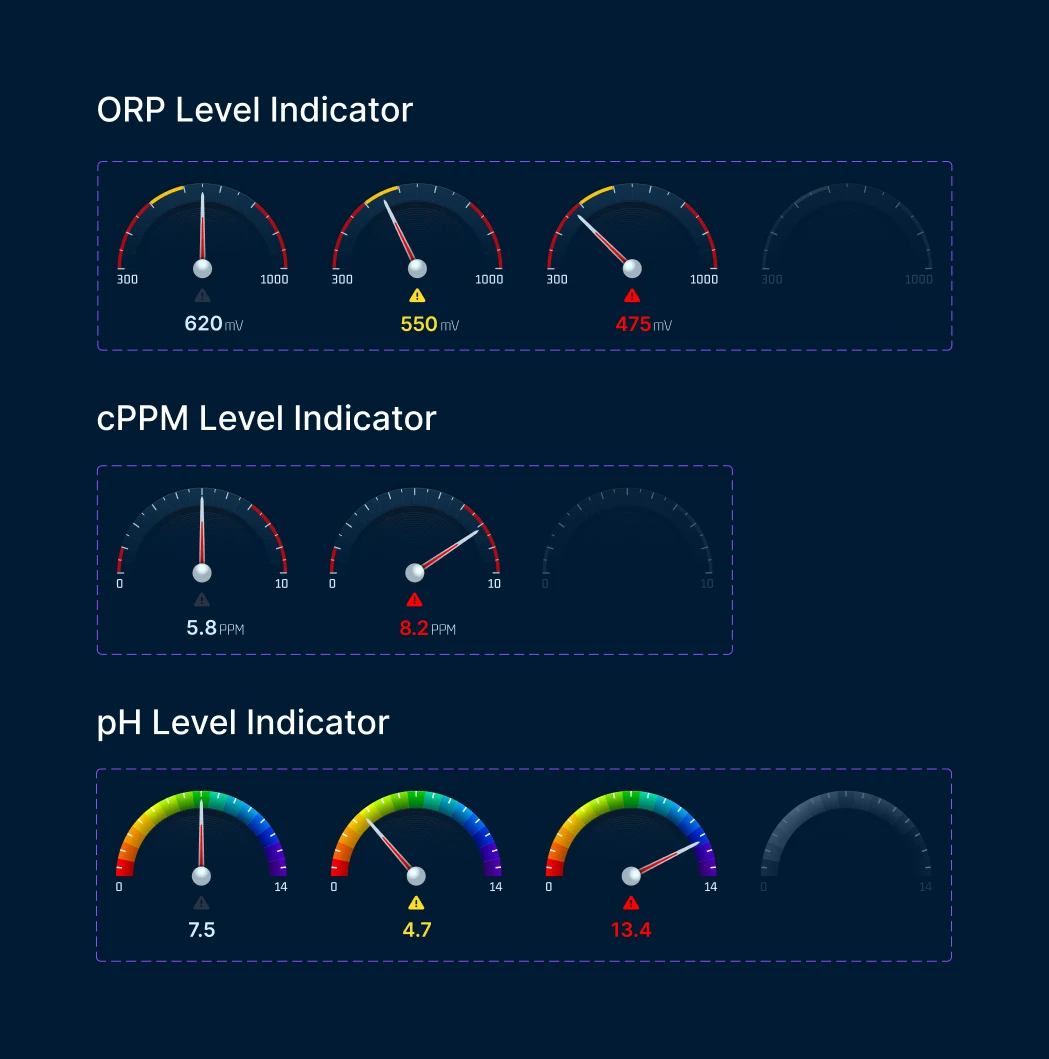
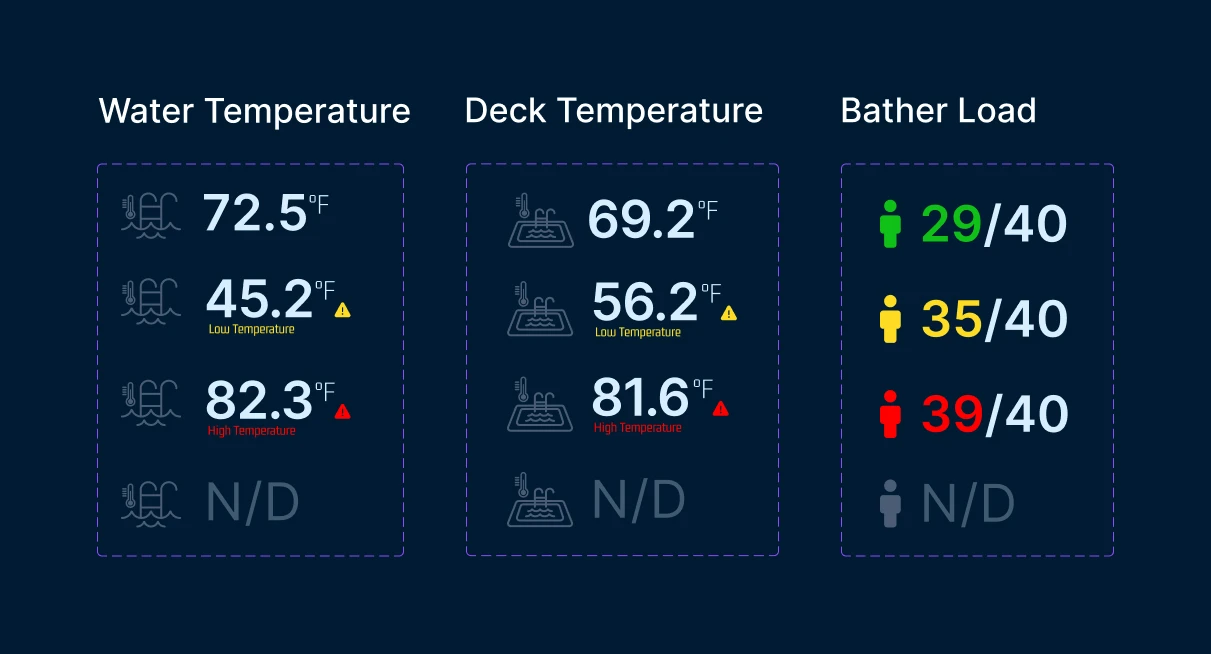
State Visibility
Colour-coded states for quickly identifying normal, warning, and critical conditions.
Visual Foundations
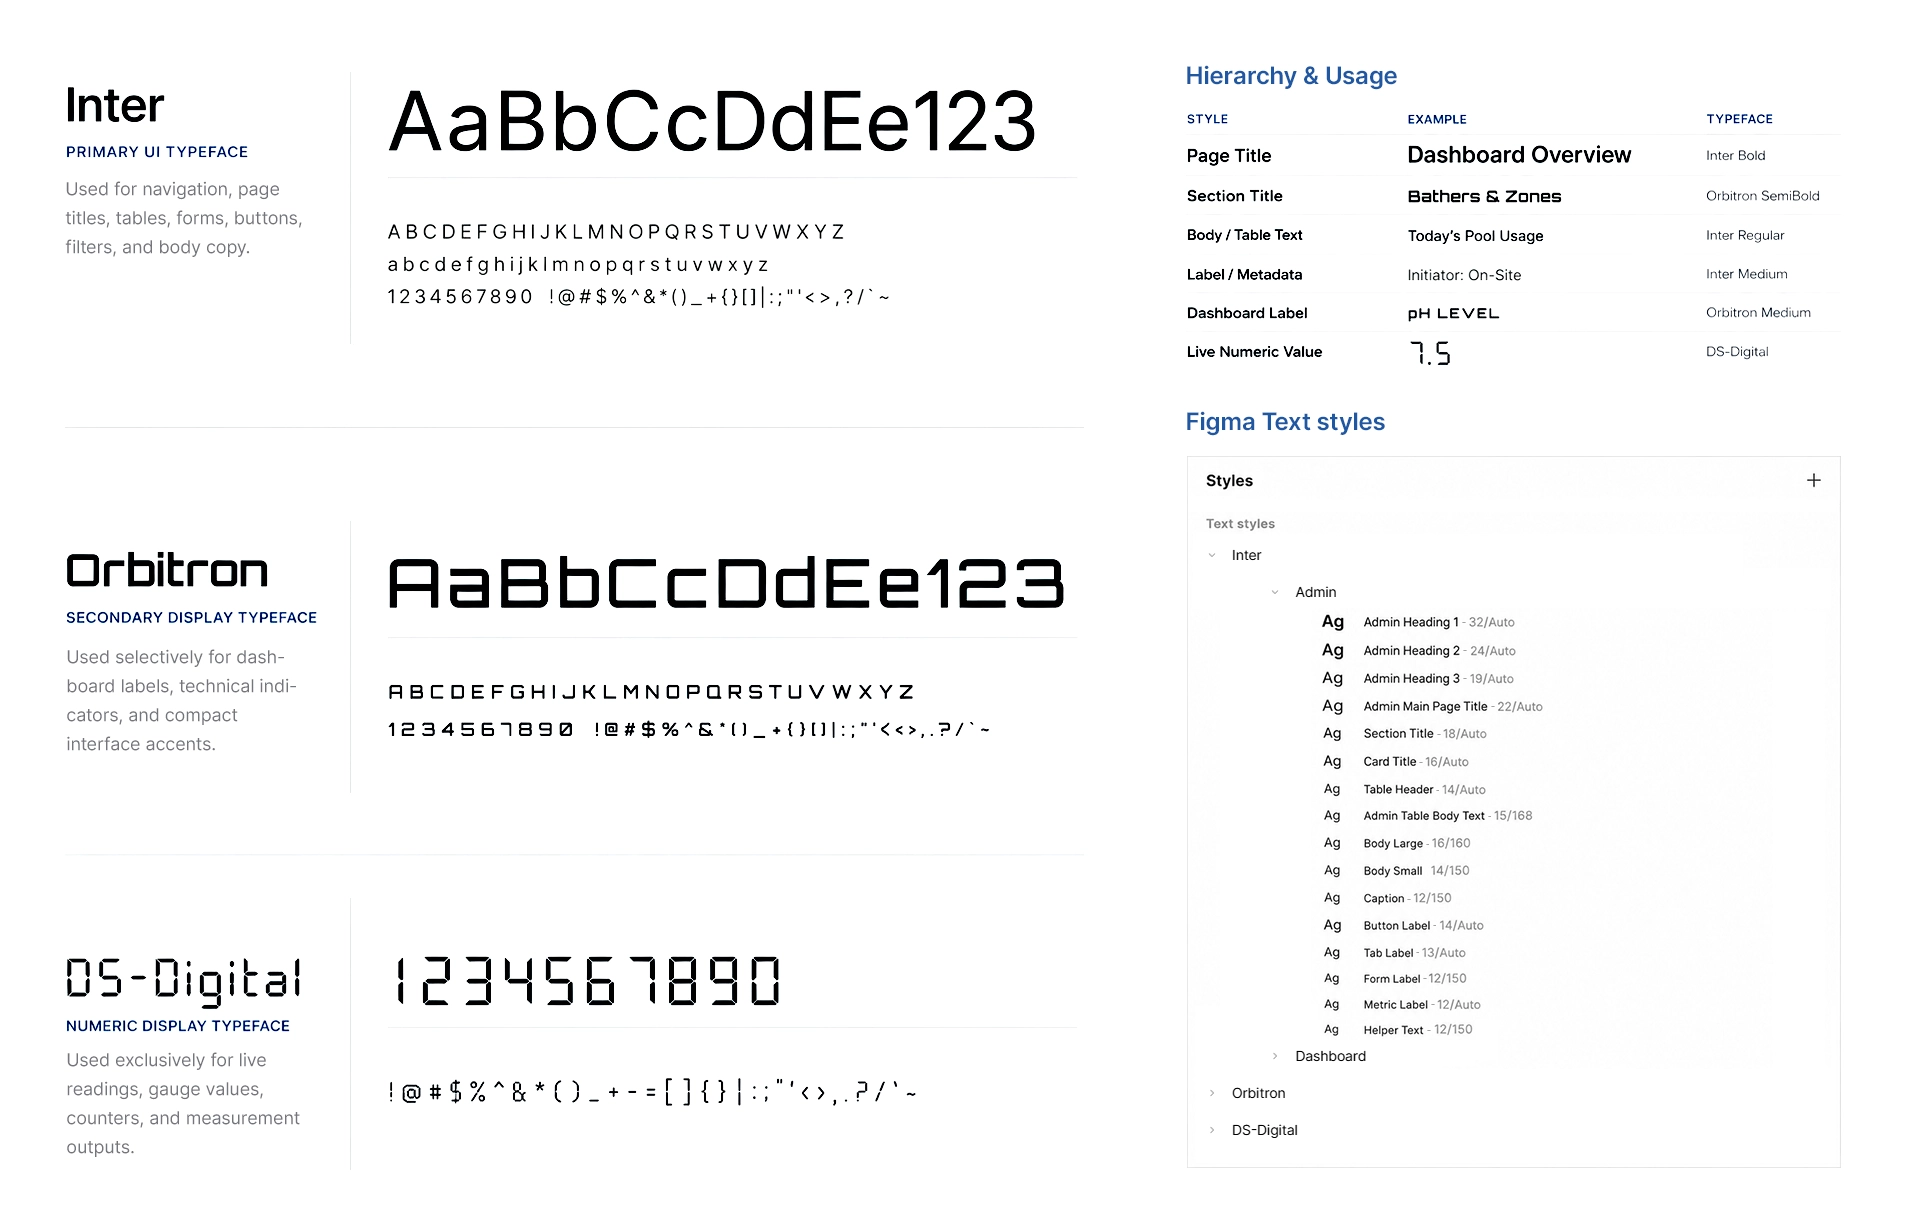
Typography
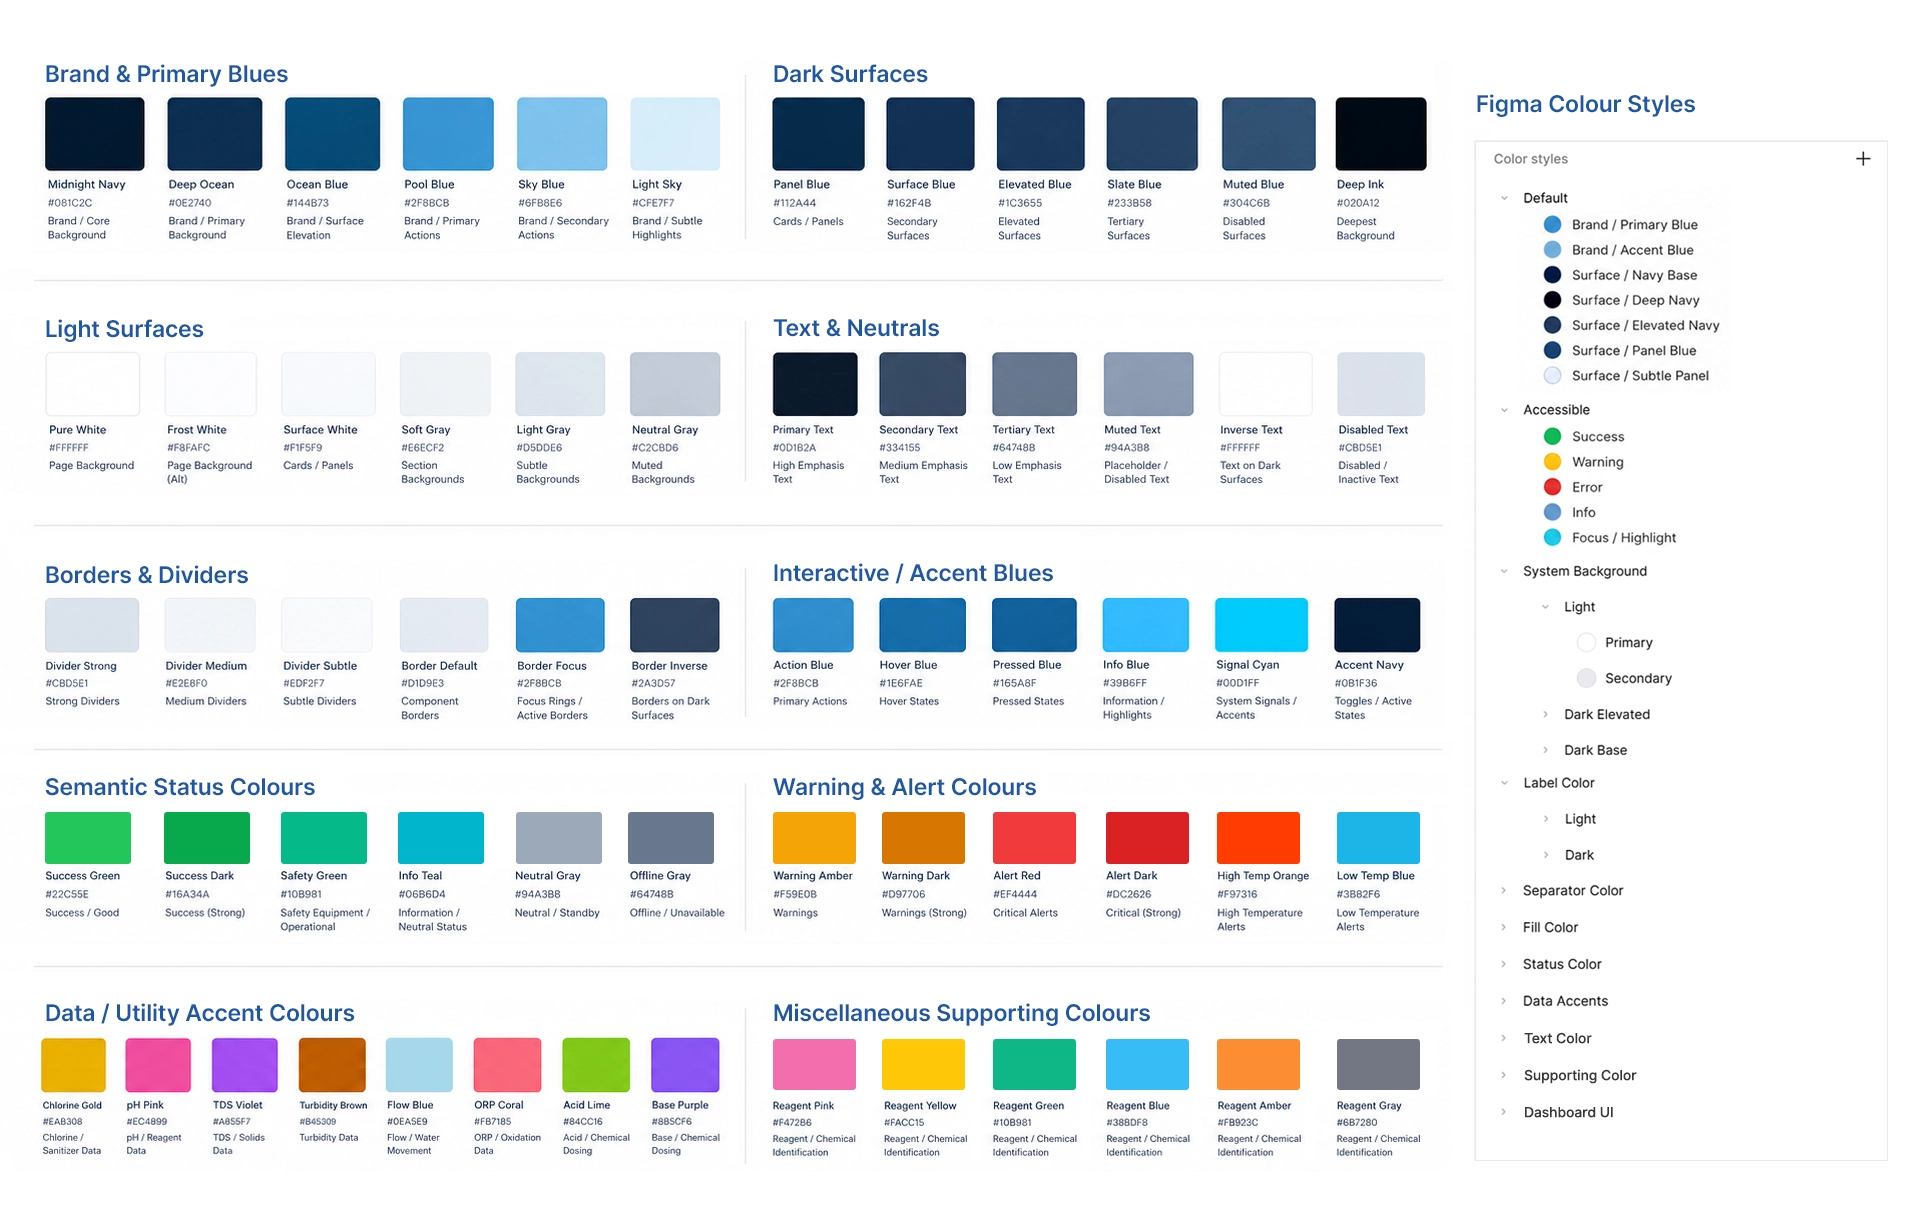
Color System
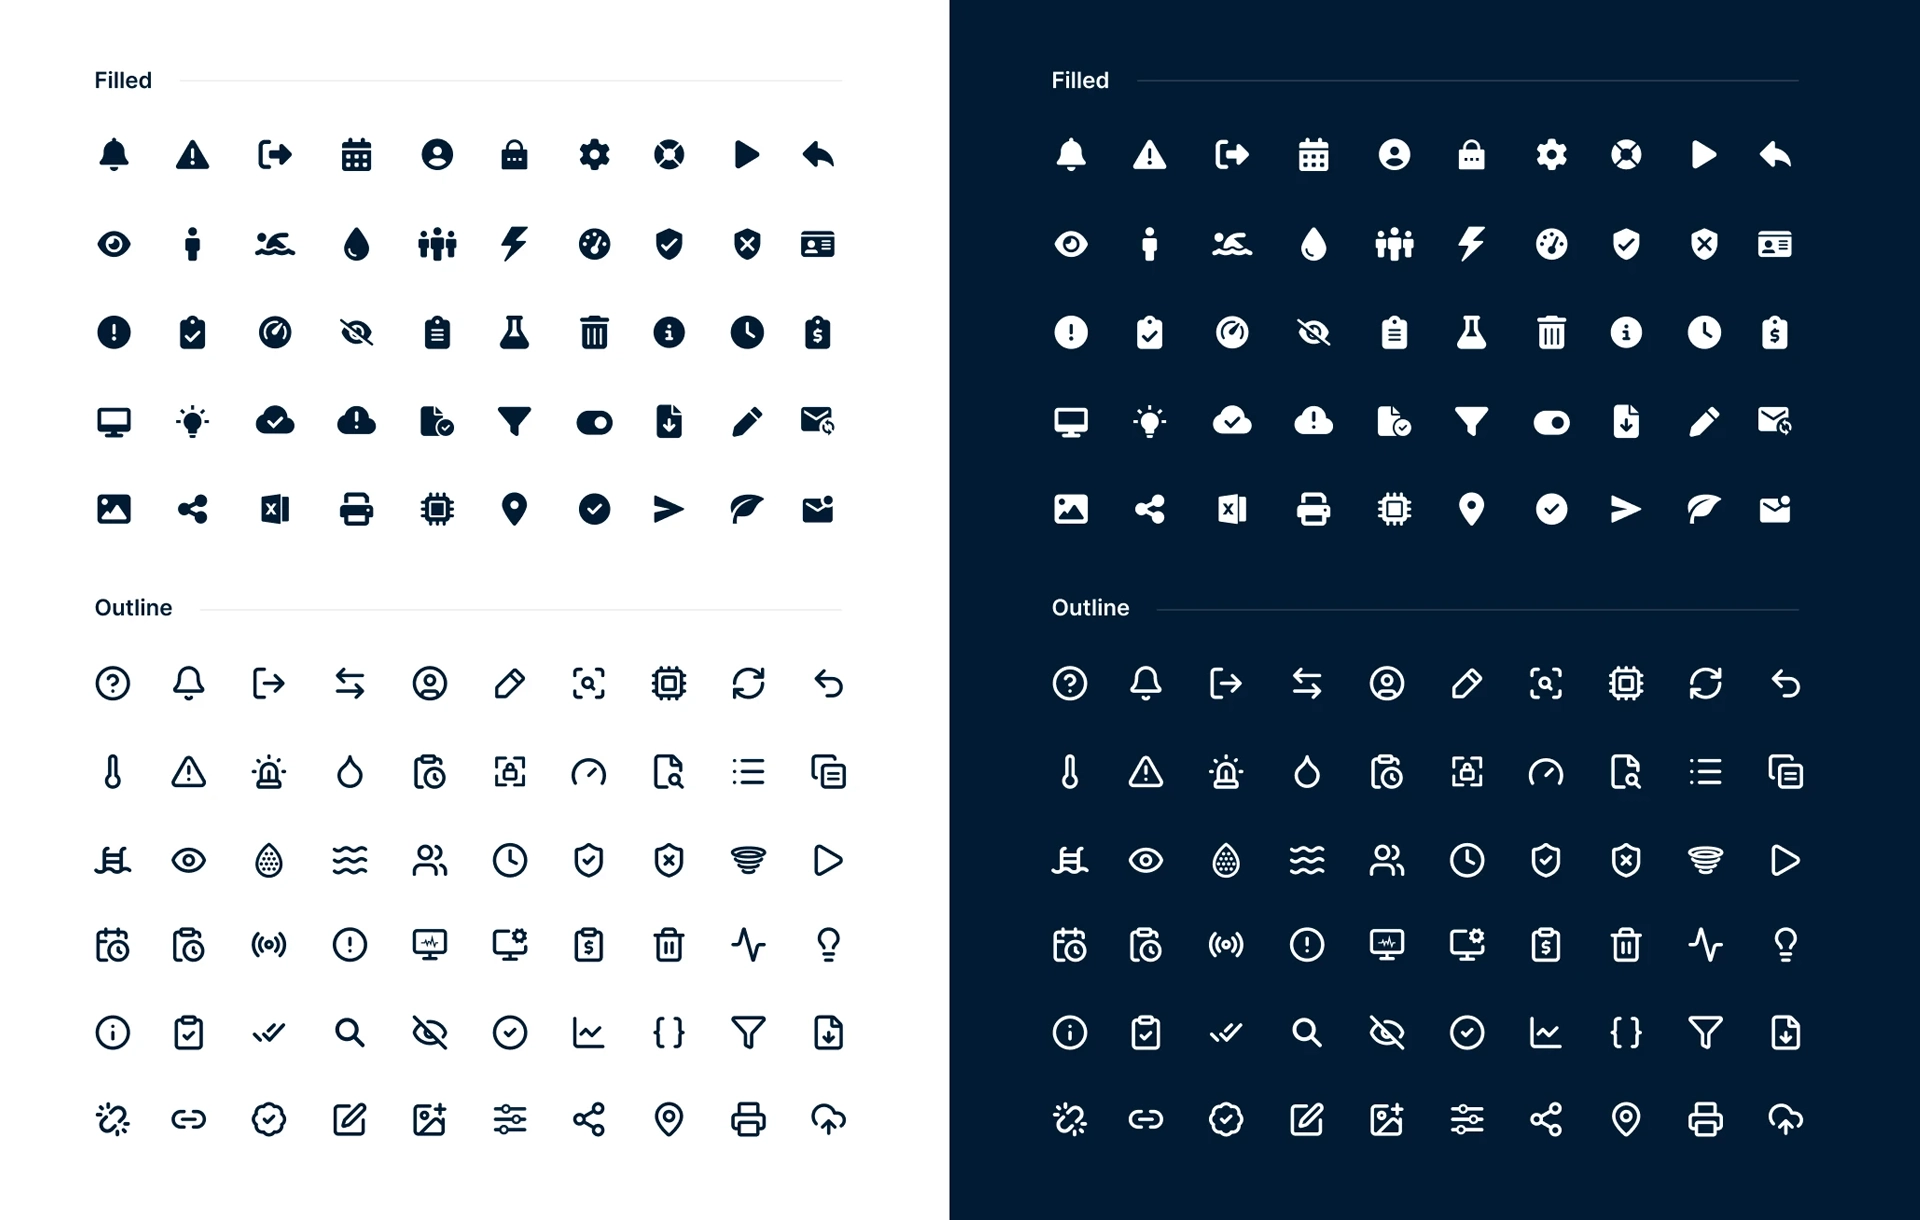
Iconography
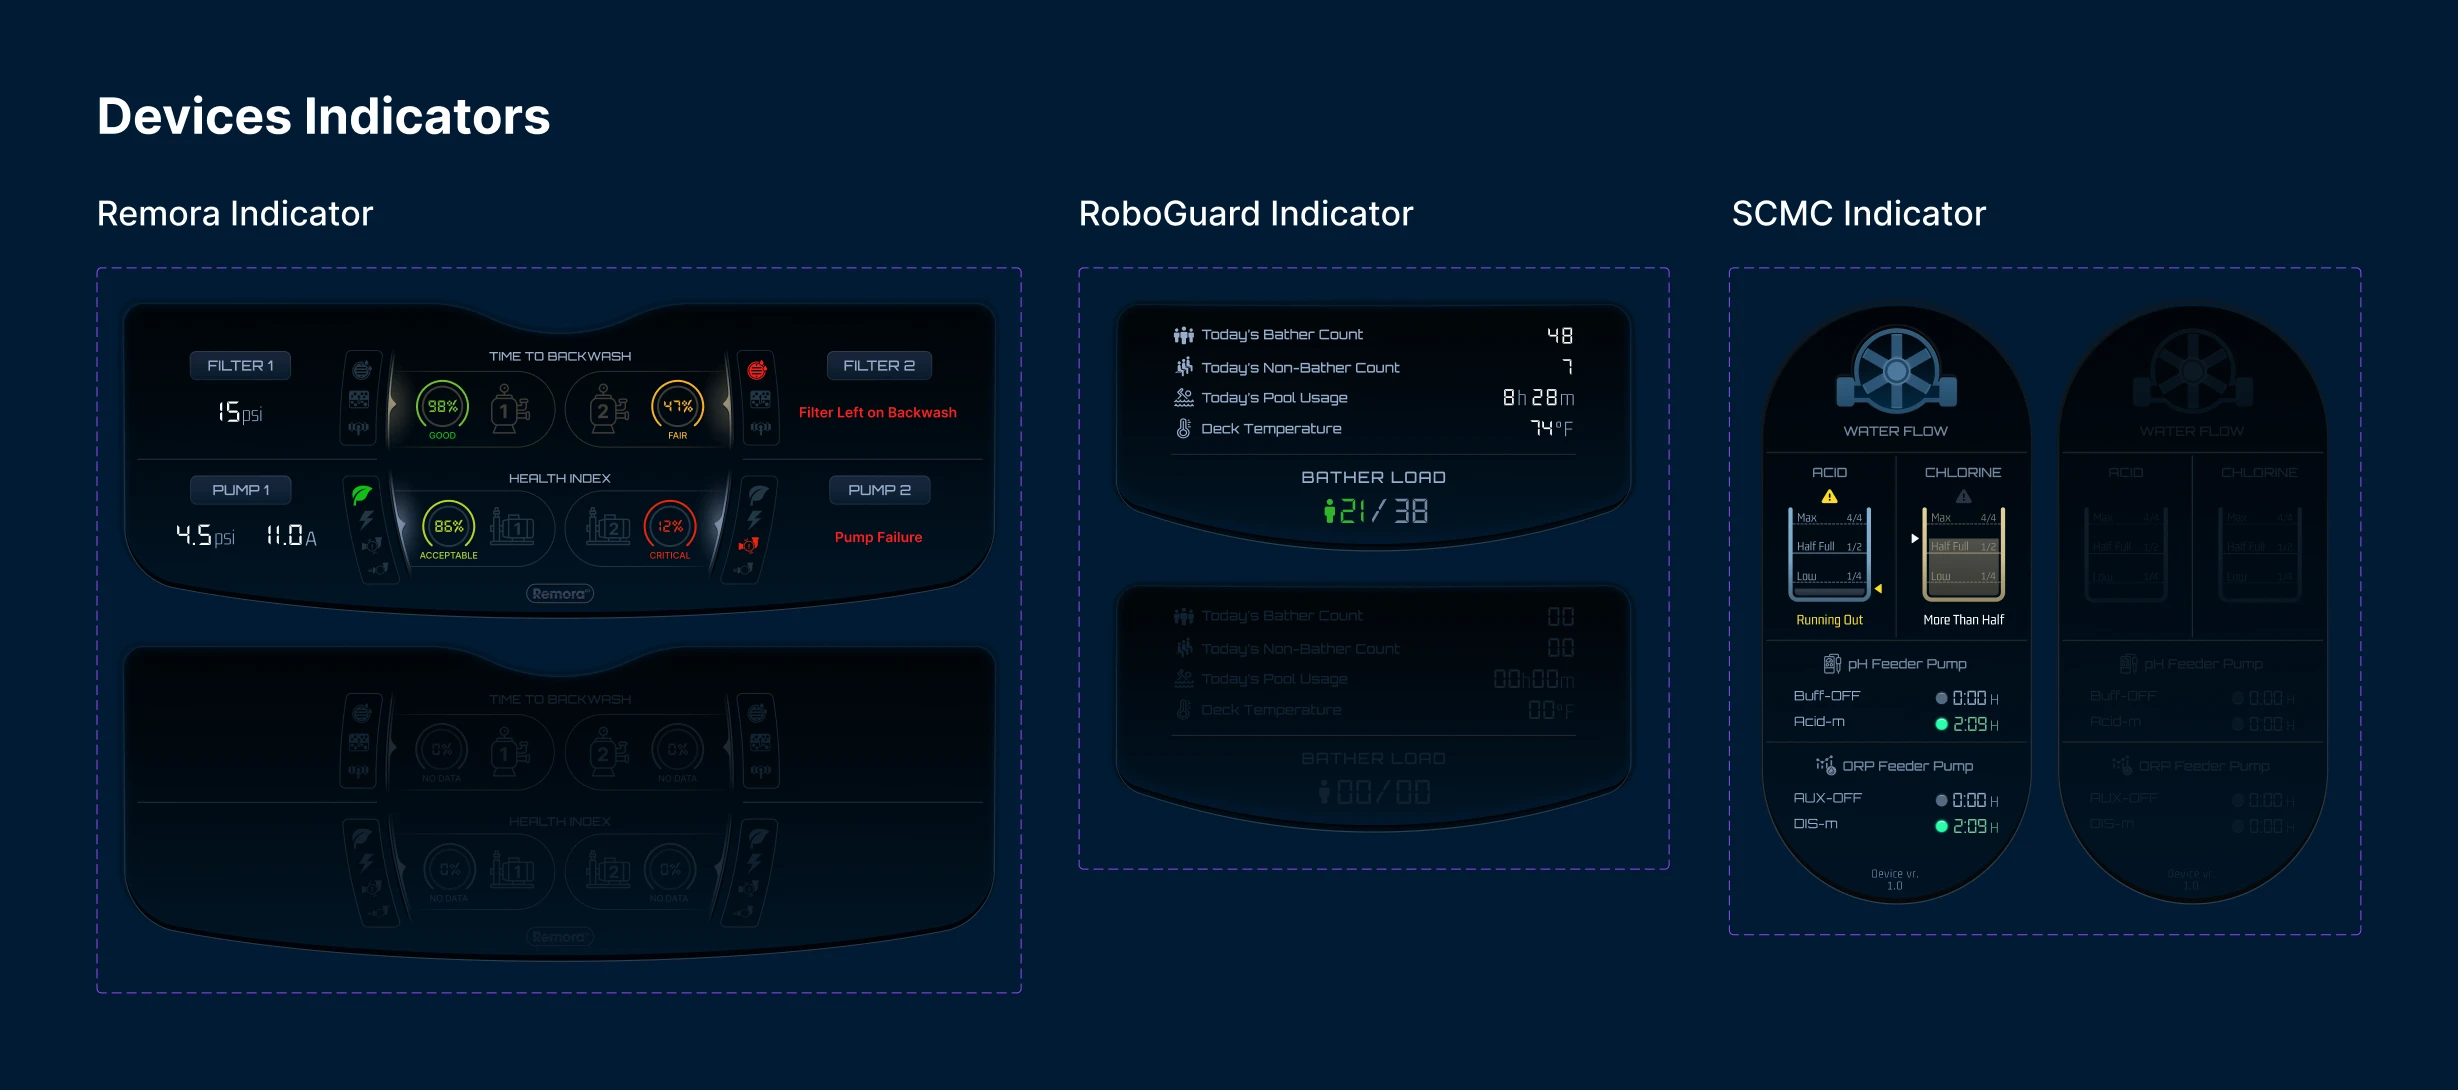
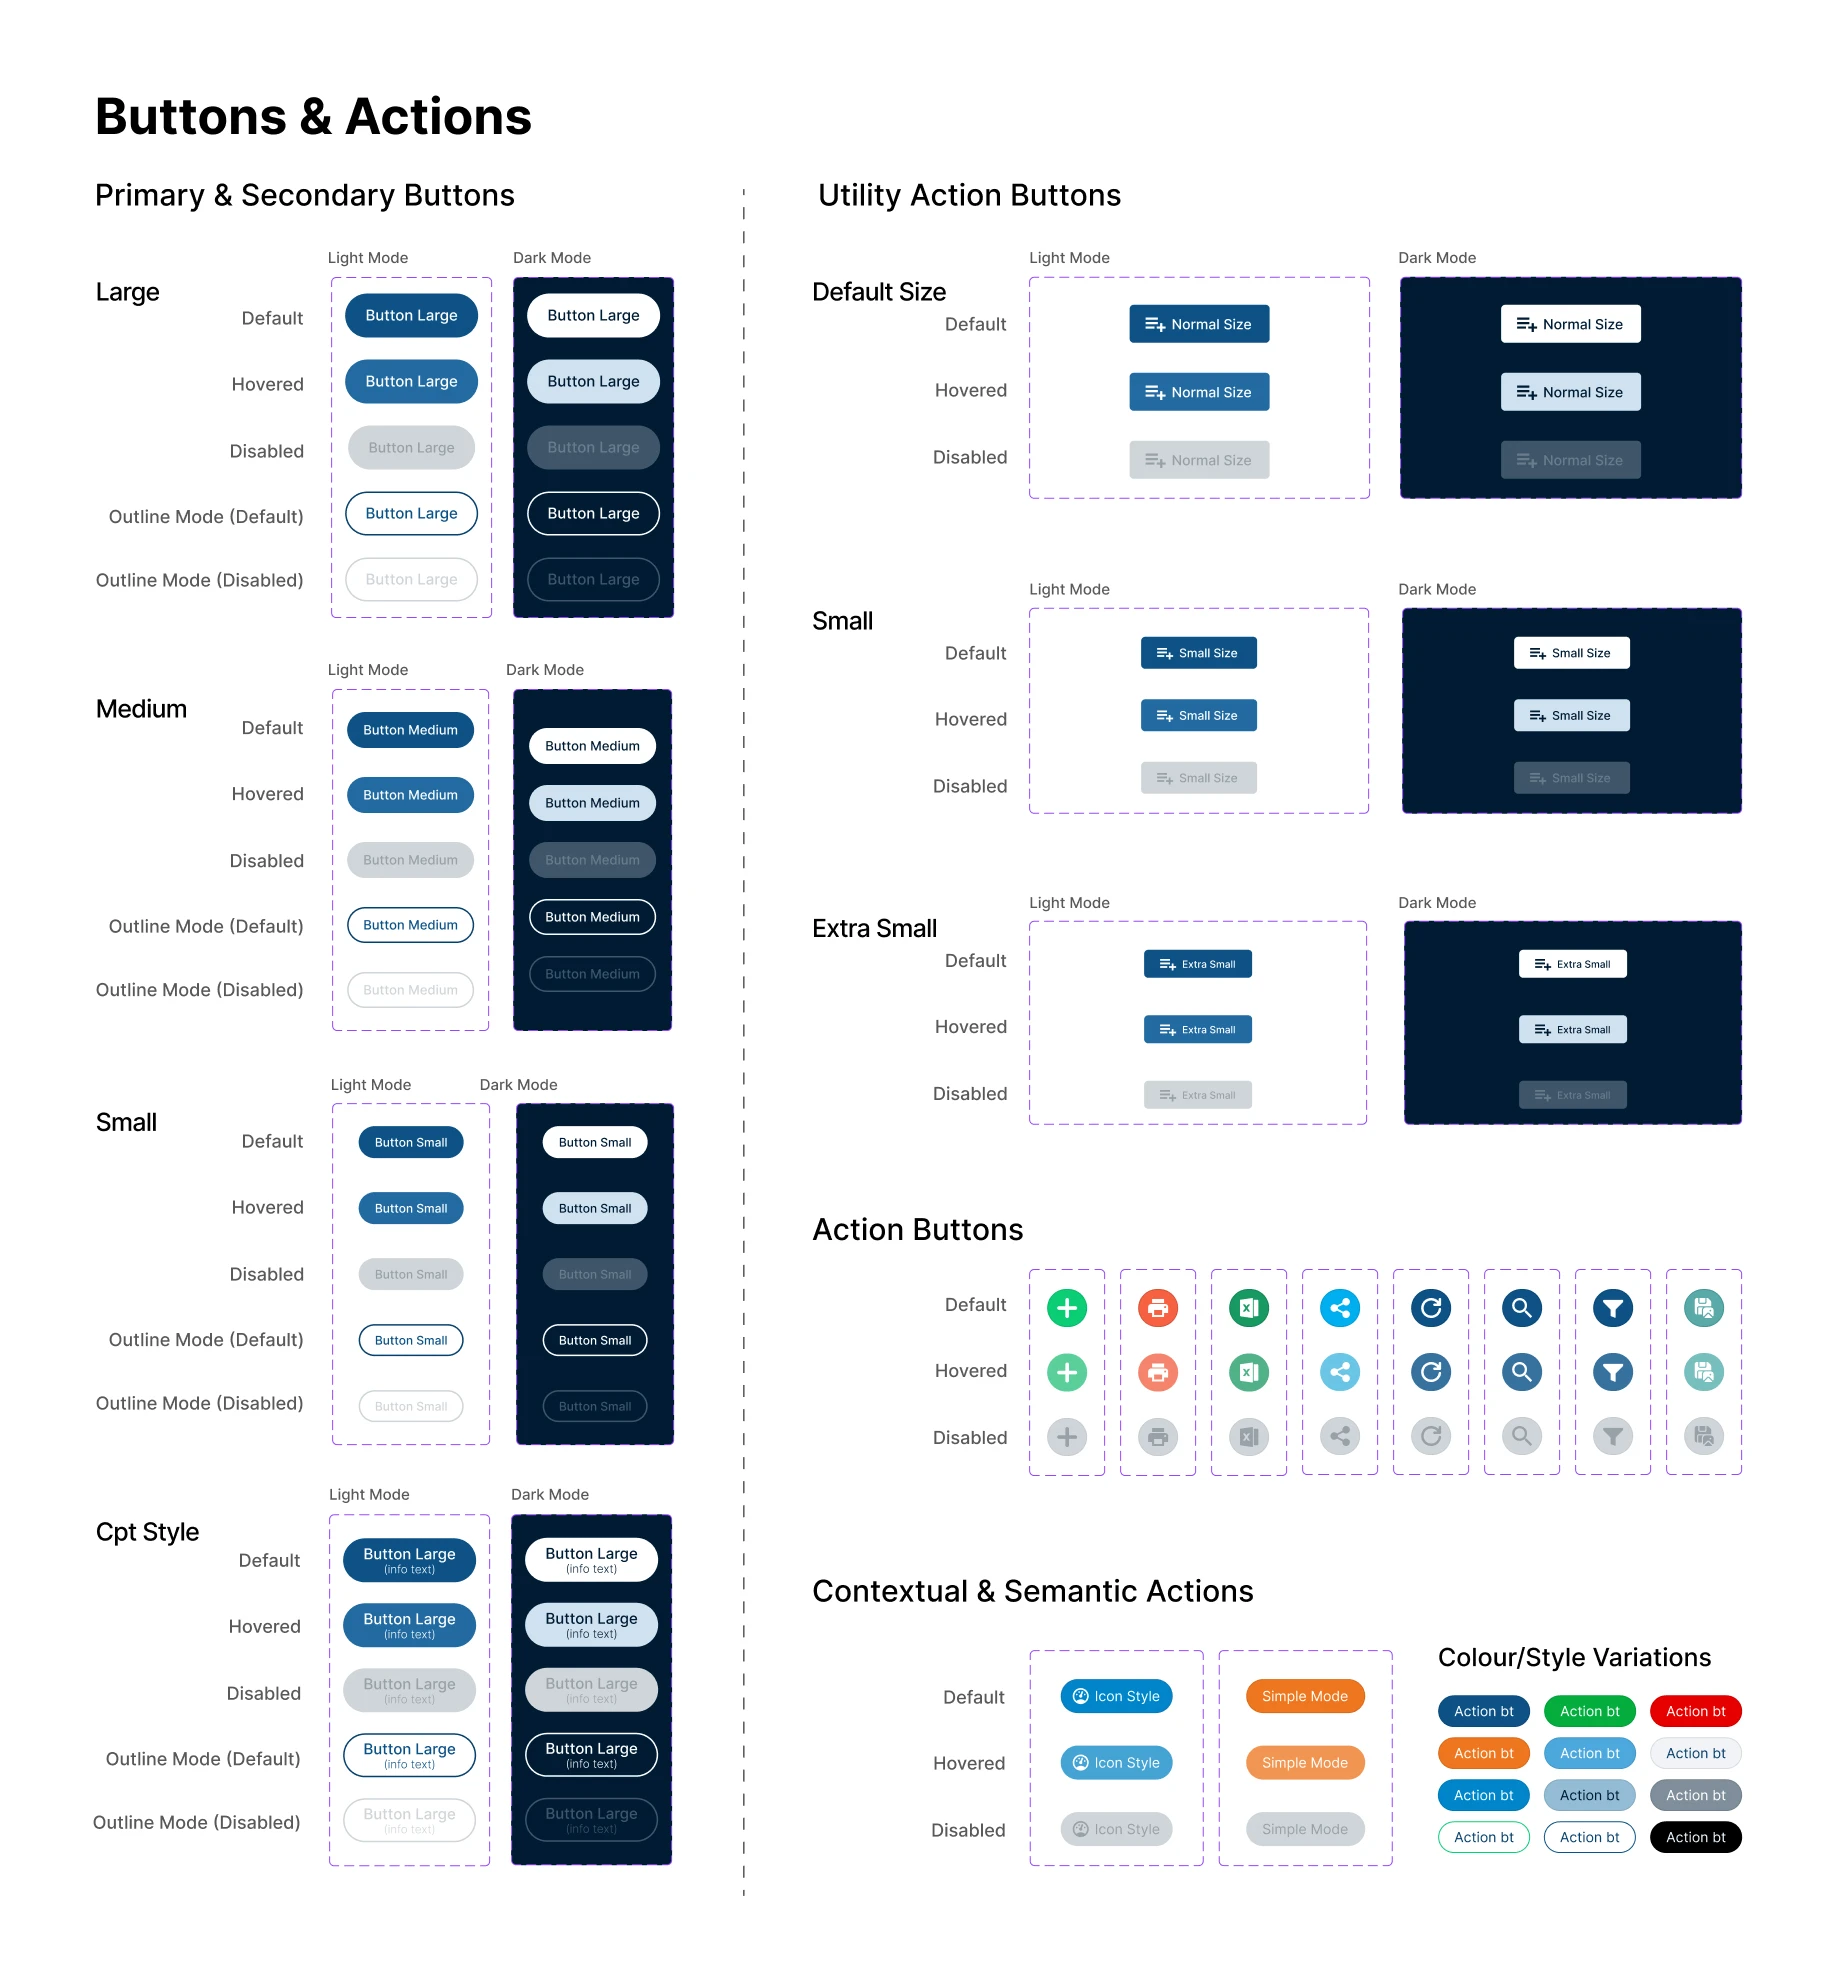
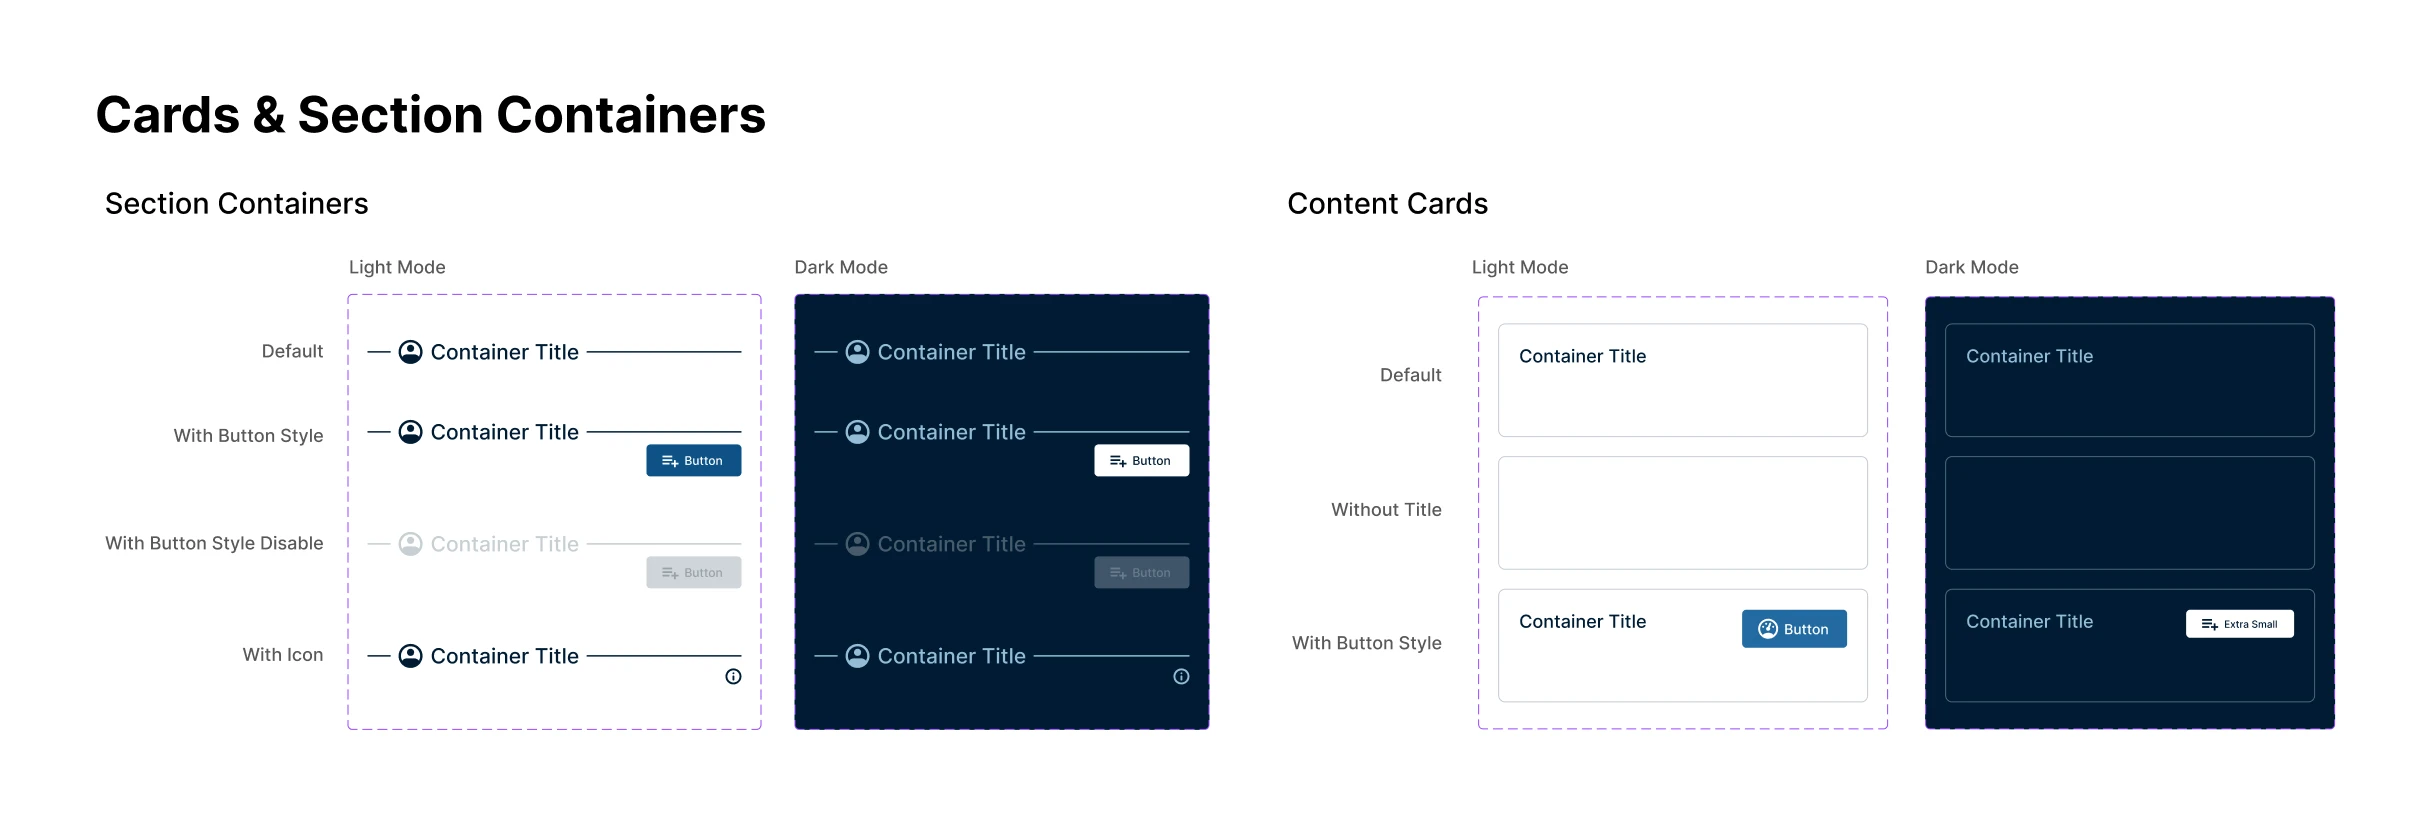
Reusable Interface Patterns
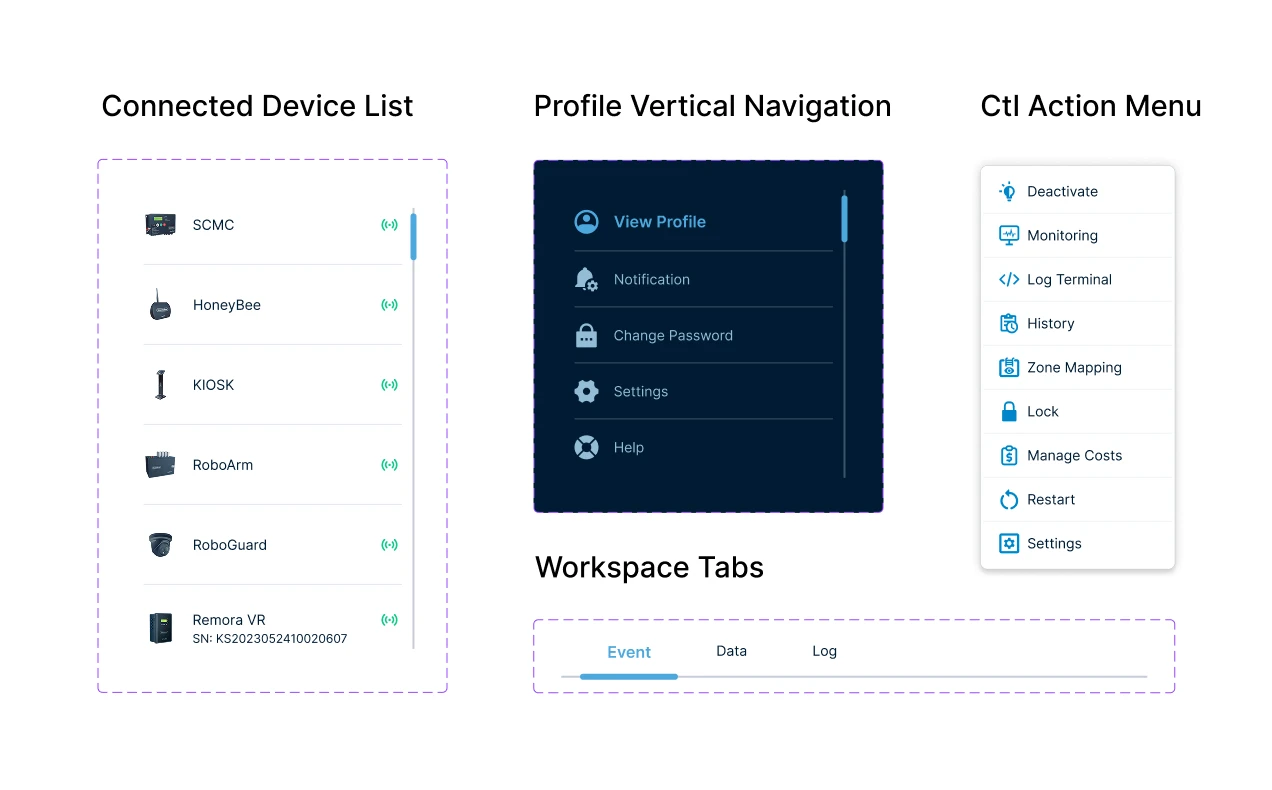
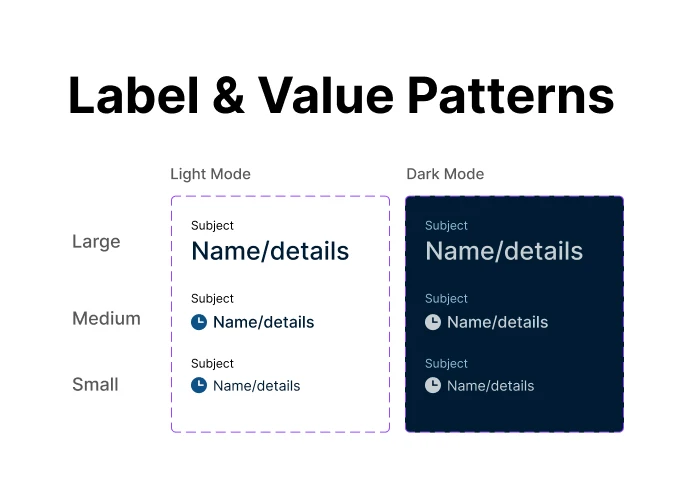
Operational Dashboard Components