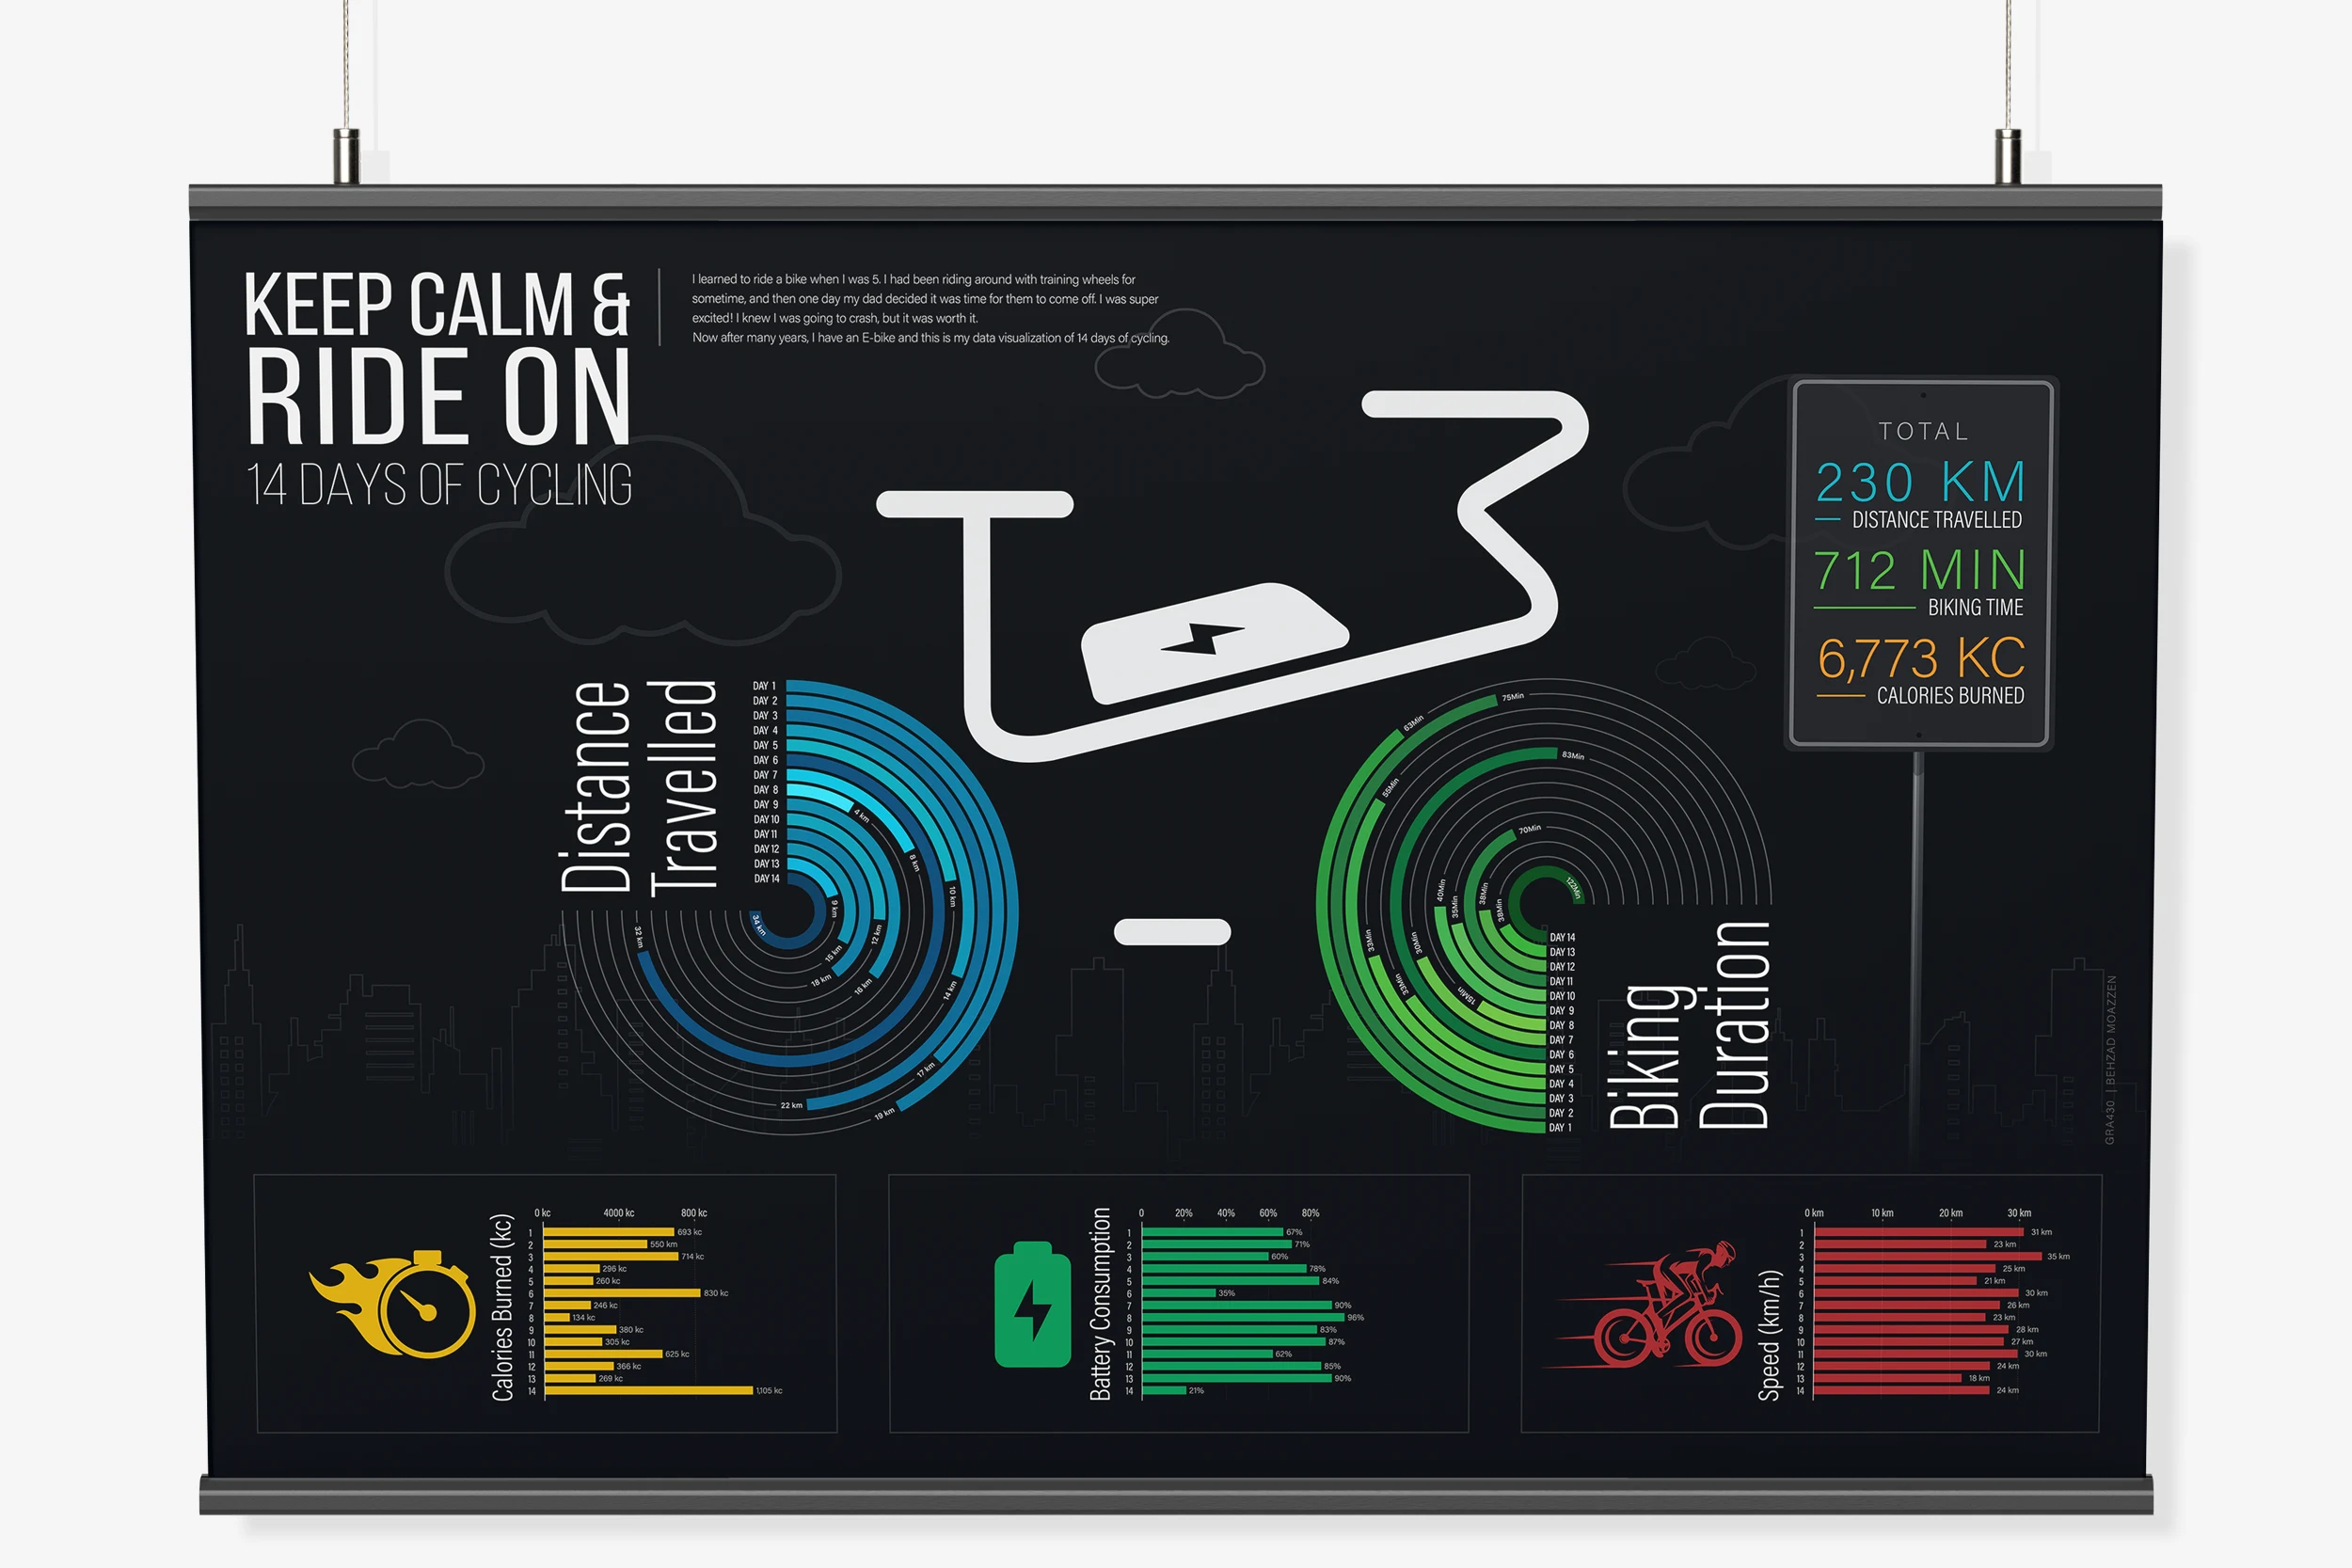
Personal data visualization project based on 14 days of cycling activity. I collected and organized data around distance, biking duration, calories burned, battery usage, and speed, then translated it into a visual infographic system. The goal was to turn everyday activity data into a clear, engaging, and visually structured story.
ClientAcademic ConceptServicesInformation Design, Data Visualization, Infographic DesignYear2022